Note
Go to the end to download the full example code.
Comparing backbone methods side by side#
This example runs every statistical and structural method on
nx.les_miserables_graph() at the cut its API page documents, then draws
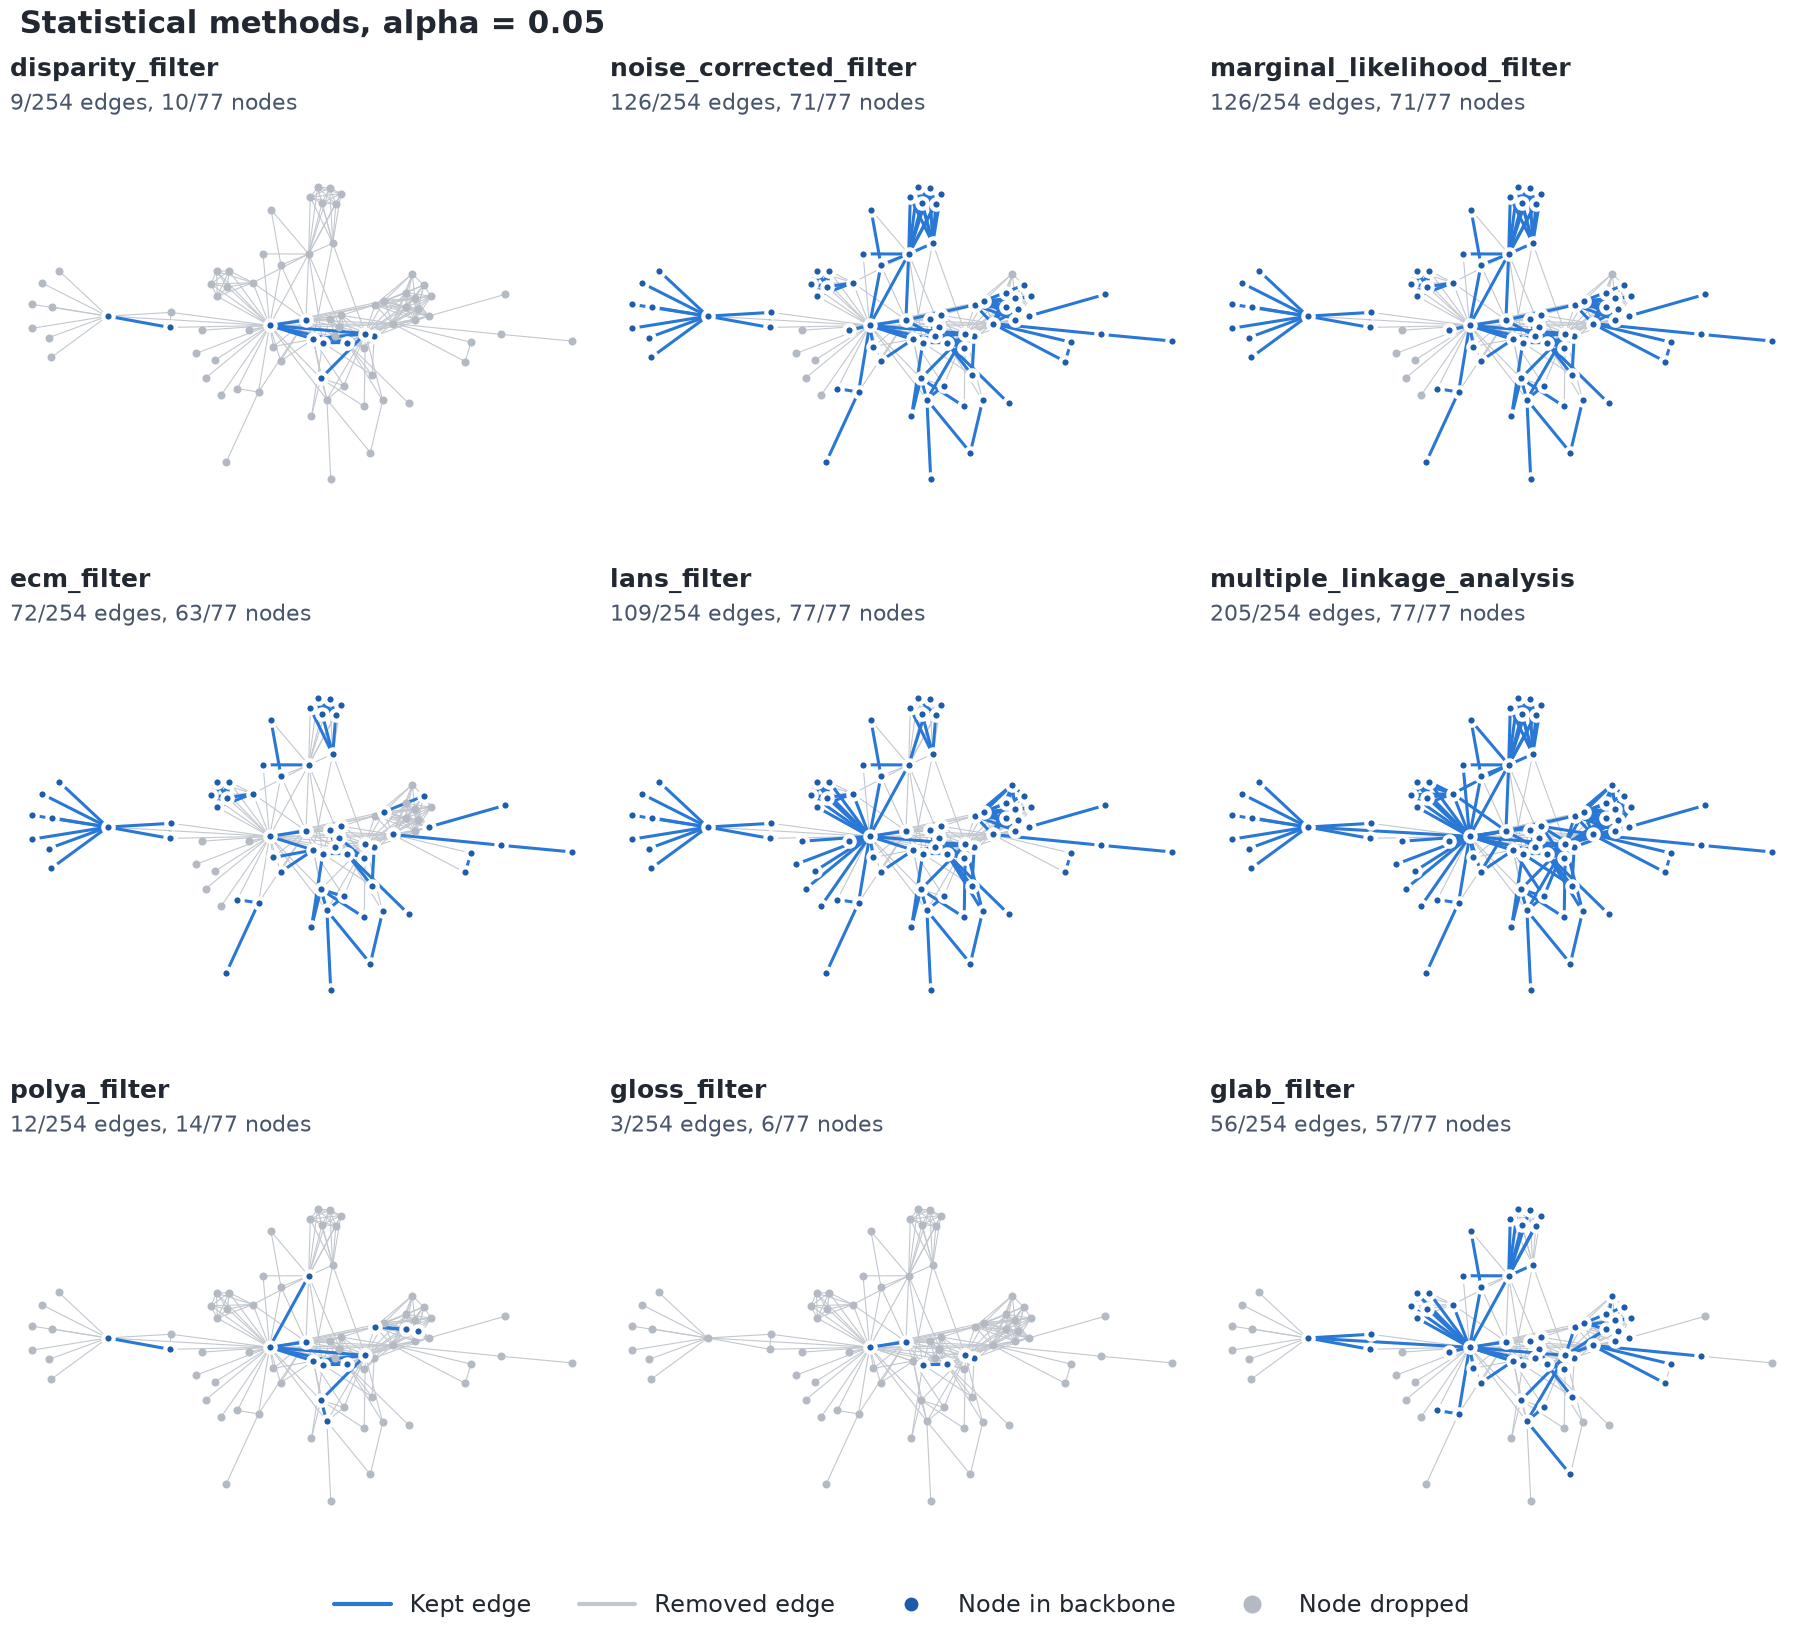
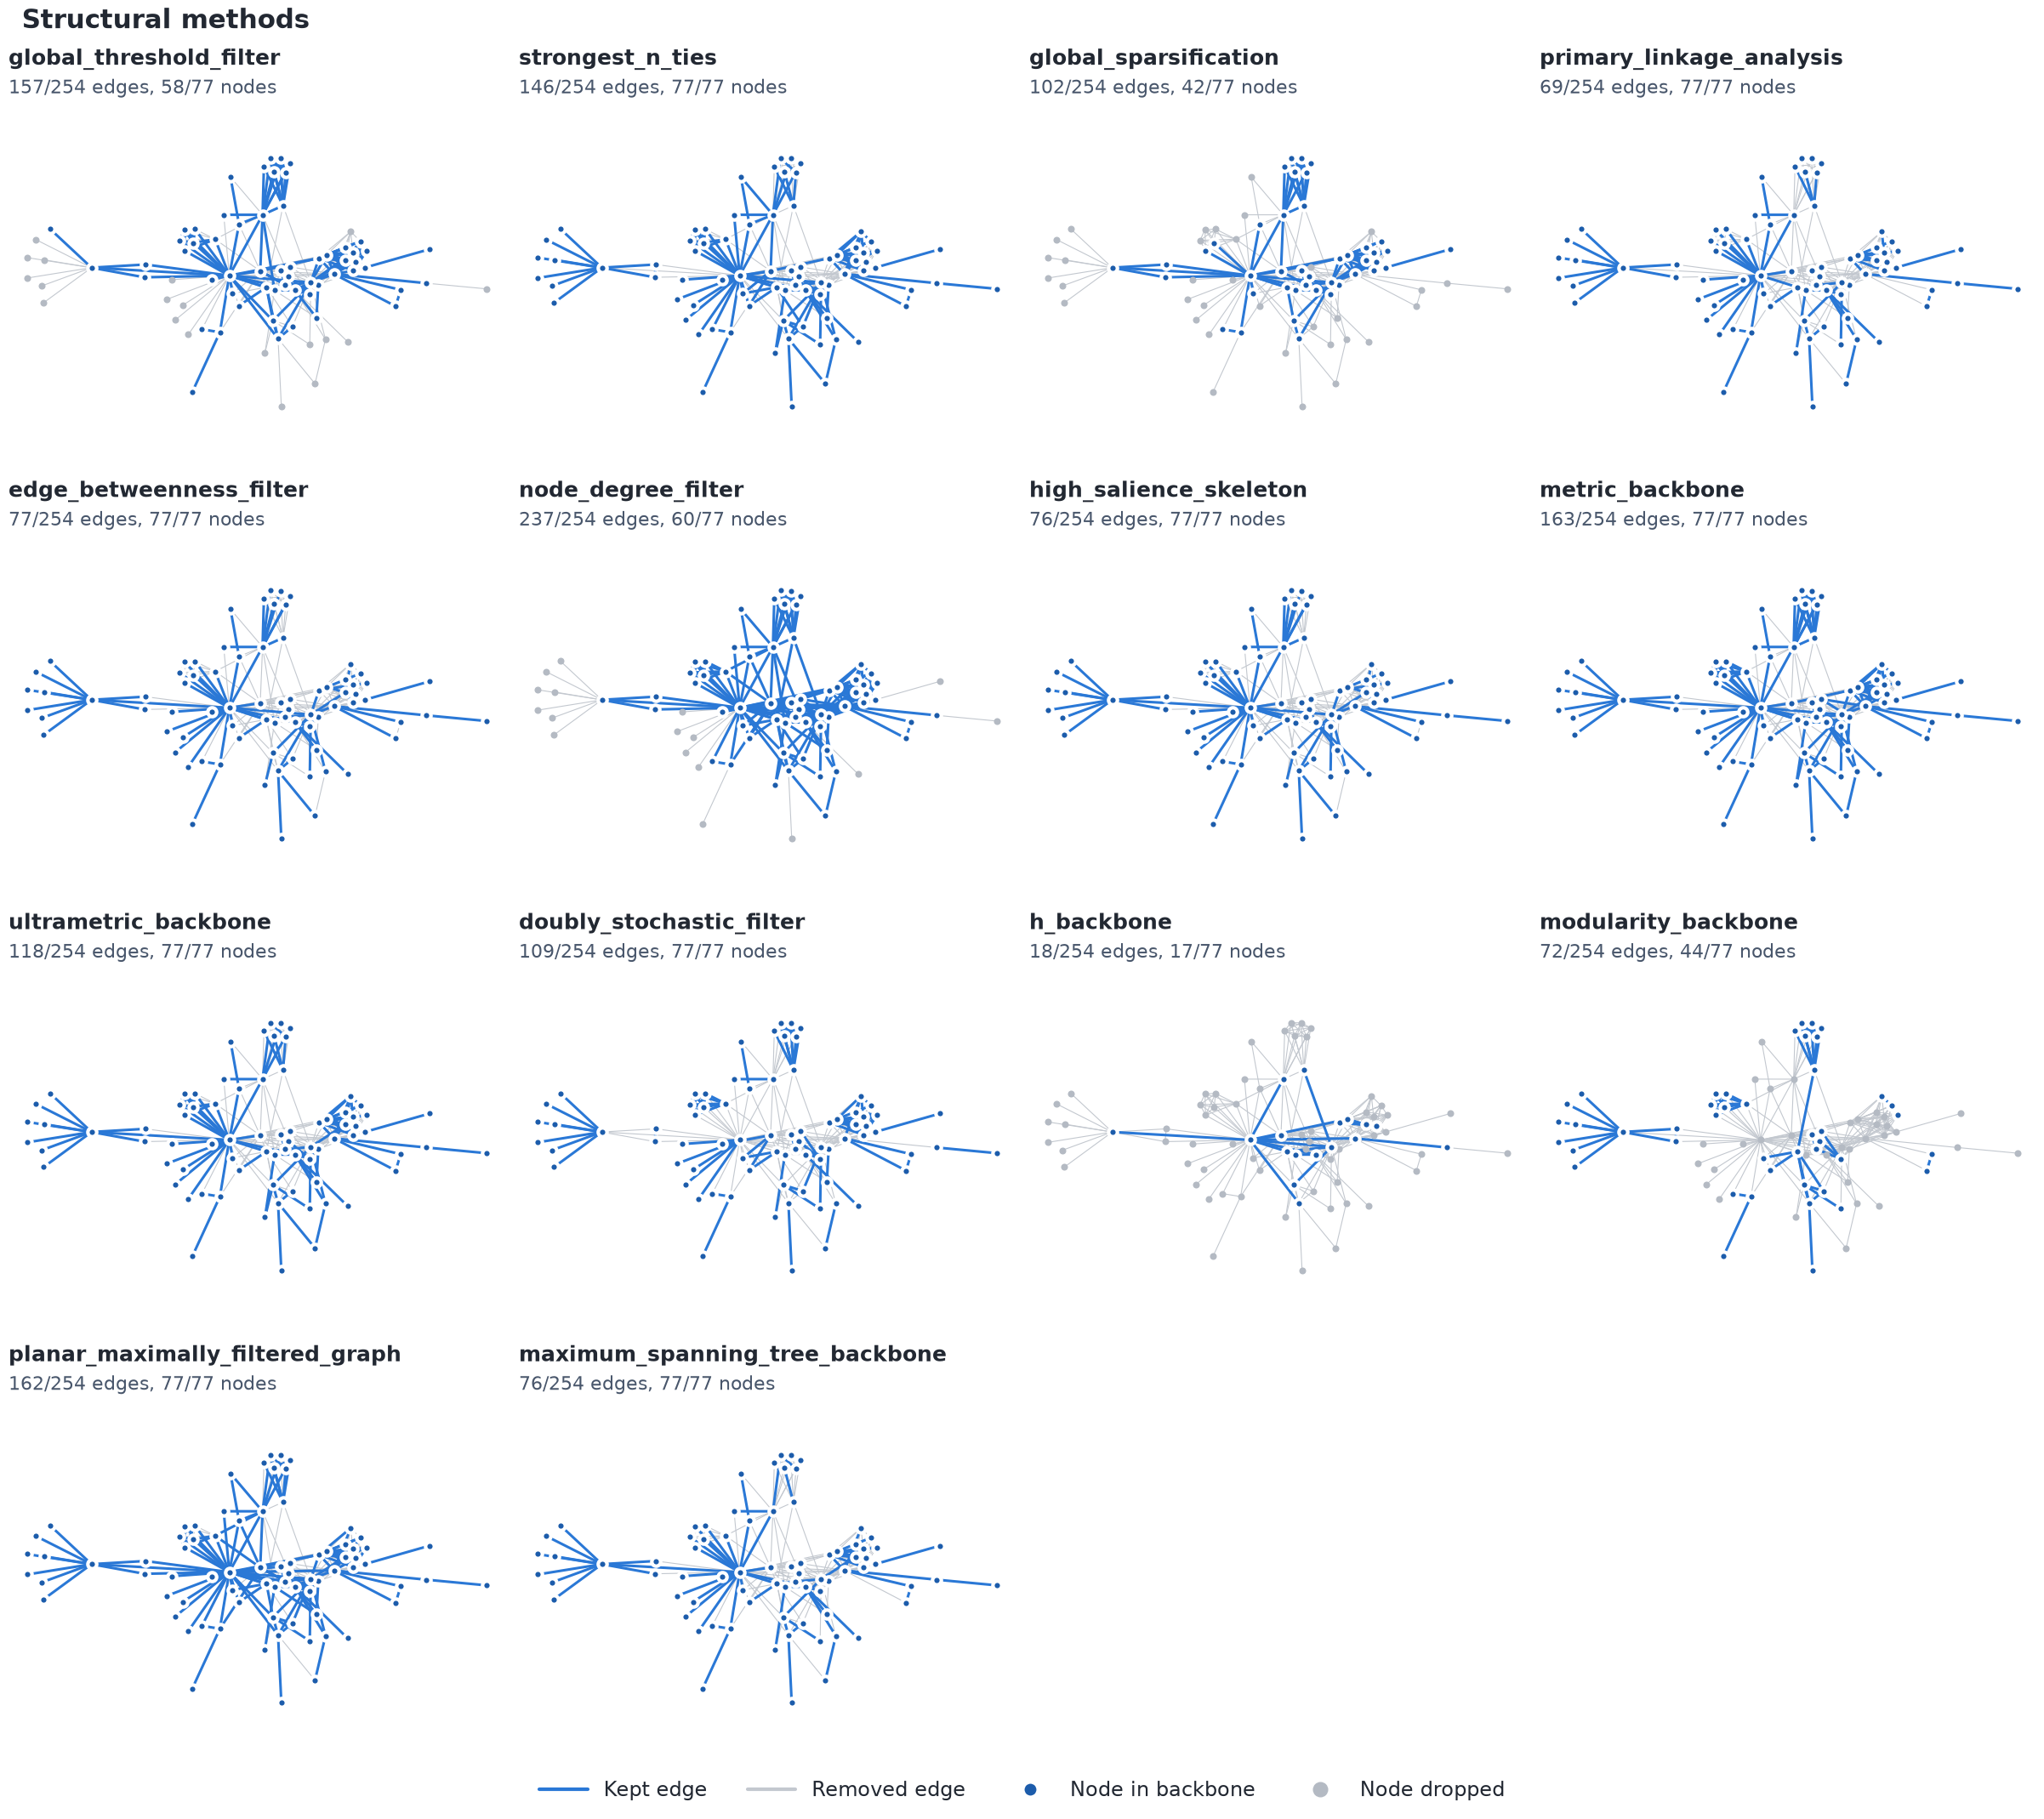
each backbone over the original graph as small multiples. All panels share one
layout, so a character sits in the same place in every panel, and the
differences between methods are differences in which edges they keep.
The drawing helpers come from the documentation’s shared figure style
(docs/_figures/style.py in the repository). Outside the docs,
compare_graphs() draws the same kind of comparison.
import warnings

import matplotlib.pyplot as plt
import networkx as nx
from _figures import style

import nx_backbone as nb

G = nx.les_miserables_graph()
pos = style.layout(G, "les_miserables")
alpha = 0.05


def below(scored, score, threshold=alpha):
    """Keep the edges whose ``score`` is below ``threshold`` (p-values)."""
    return nb.threshold_filter(scored, score, threshold, include_all_nodes=False)


def above(scored, score, threshold):
    """Keep the edges whose ``score`` is at least ``threshold``."""
    return nb.threshold_filter(
        scored, score, threshold, mode="above", include_all_nodes=False
    )
Score, then filter#
Each method scores every edge of the full graph; a filter then extracts the backbone. The statistical methods test each edge against a null model and keep those with p < 0.05. The structural methods keep edges by a topological rule.
statistical = {
    "disparity_filter": lambda: below(nb.disparity_filter(G), "disparity_pvalue"),
    "noise_corrected_filter": lambda: below(nb.noise_corrected_filter(G), "nc_pvalue"),
    "marginal_likelihood_filter": lambda: below(
        nb.marginal_likelihood_filter(G), "ml_pvalue"
    ),
    "ecm_filter": lambda: below(nb.ecm_filter(G), "ecm_pvalue"),
    "lans_filter": lambda: below(nb.lans_filter(G), "lans_pvalue"),
    "multiple_linkage_analysis": lambda: nb.boolean_filter(
        nb.multiple_linkage_analysis(G), "mla_keep"
    ),
    "polya_filter": lambda: below(nb.polya_filter(G), "polya_pvalue"),
    "gloss_filter": lambda: below(nb.gloss_filter(G), "gloss_pvalue"),
    "glab_filter": lambda: below(nb.glab_filter(G), "glab_pvalue"),
}

structural = {
    "global_threshold_filter": lambda: nb.boolean_filter(
        nb.global_threshold_filter(G, threshold=2.0), "global_threshold_keep"
    ),
    "strongest_n_ties": lambda: nb.boolean_filter(
        nb.strongest_n_ties(G, n=2), "strongest_n_ties_keep"
    ),
    "global_sparsification": lambda: nb.boolean_filter(
        nb.global_sparsification(G, s=0.4), "global_sparsification_keep"
    ),
    "primary_linkage_analysis": lambda: nb.boolean_filter(
        nb.primary_linkage_analysis(G), "primary_linkage_keep"
    ),
    "edge_betweenness_filter": lambda: nb.boolean_filter(
        nb.edge_betweenness_filter(G, s=0.3), "edge_betweenness_keep"
    ),
    "node_degree_filter": lambda: nb.boolean_filter(
        nb.node_degree_filter(G, min_degree=2), "node_degree_keep"
    ),
    "high_salience_skeleton": lambda: above(
        nb.high_salience_skeleton(G), "salience", 0.5
    ),
    "metric_backbone": lambda: nb.boolean_filter(nb.metric_backbone(G), "metric_keep"),
    "ultrametric_backbone": lambda: nb.boolean_filter(
        nb.ultrametric_backbone(G), "ultrametric_keep"
    ),
    "doubly_stochastic_filter": lambda: above(
        nb.doubly_stochastic_filter(G), "ds_weight", 0.1
    ),
    "h_backbone": lambda: nb.boolean_filter(nb.h_backbone(G), "h_backbone_keep"),
    "modularity_backbone": lambda: nb.boolean_filter(
        nb.modularity_backbone(G, seed=42), "modularity_keep"
    ),
    "planar_maximally_filtered_graph": lambda: nb.boolean_filter(
        nb.planar_maximally_filtered_graph(G), "pmfg_keep"
    ),
    "maximum_spanning_tree_backbone": lambda: nb.boolean_filter(
        nb.maximum_spanning_tree_backbone(G), "mst_keep"
    ),
}

backbones = {}
with warnings.catch_warnings():
    warnings.simplefilter("ignore")  # convergence notes are the API pages' topic
    for methods in (statistical, structural):
        for name, run in methods.items():
            backbones[name] = run()
counts = {name: style.backbone_counts(G, bb) for name, bb in backbones.items()}
Small multiples#
One panel per method: the backbone in blue over the original graph in faint gray. Each panel’s subtitle gives the edges and nodes it keeps.
def small_multiples(names, title, ncols=3):
    nrows = -(-len(names) // ncols)
    fig, axes = plt.subplots(
        nrows,
        ncols,
        figsize=(3.0 * ncols, 2.5 * nrows + 0.7),
        layout="constrained",
    )
    for ax in axes.flat[len(names) :]:
        ax.set_axis_off()
    for ax, name in zip(axes.flat, names):
        style.draw_backbone(
            ax,
            G,
            backbones[name],
            pos,
            legend=False,
            node_size=14,
            kept_width=1.1,
            removed_width=0.4,
        )
        ax.set_title(name, fontsize=9, pad=14)
        ax.text(
            0,
            1,
            counts[name].short,
            transform=ax.transAxes,
            fontsize=8,
            color=style.palette().muted,
            va="bottom",
        )
    fig.suptitle(title, x=0.01, ha="left")
    fig.legend(
        handles=style.legend_handles(),
        loc="outside lower center",
        ncols=4,
        handlelength=2.4,
    )
    return fig


small_multiples(list(statistical), f"Statistical methods, alpha = {alpha}")
<Figure size 900x820 with 9 Axes>
small_multiples(list(structural), "Structural methods", ncols=4)
<Figure size 1200x1070 with 16 Axes>
Edges kept#
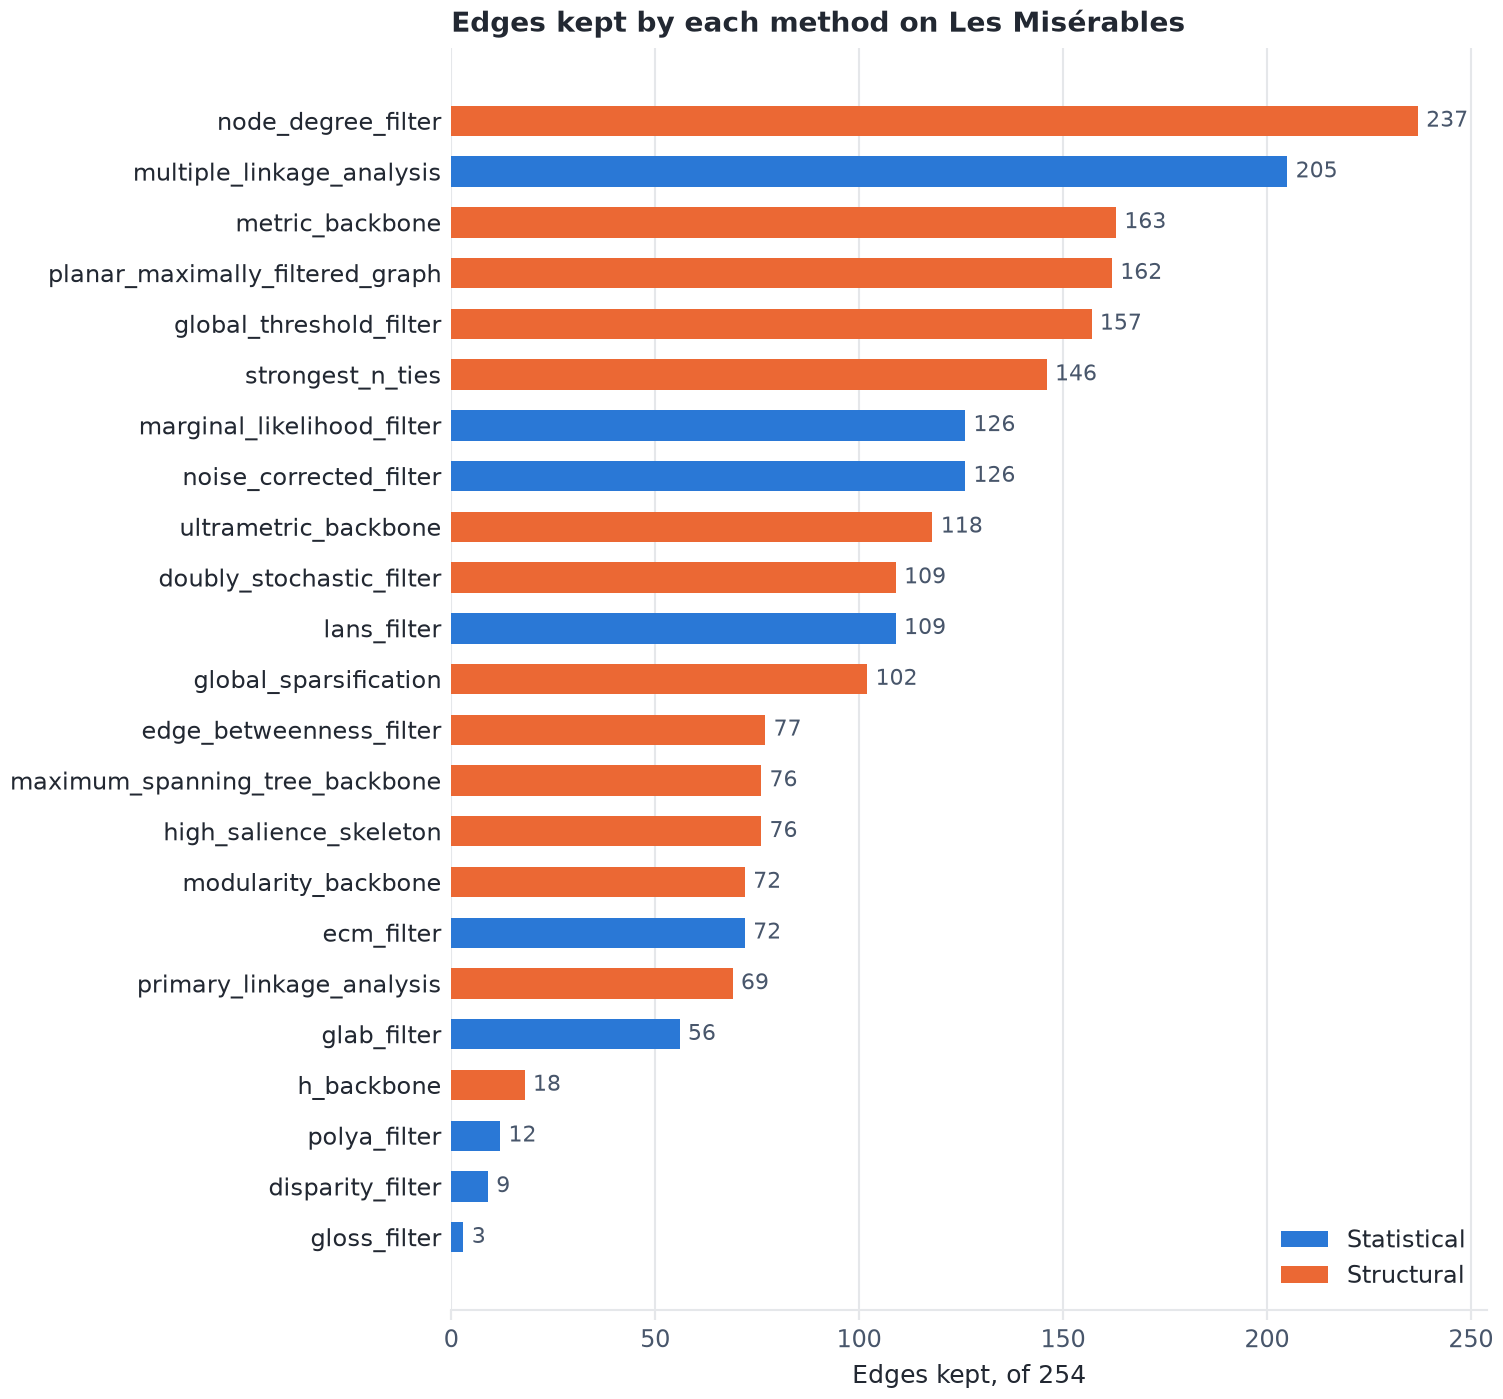
The same counts as bars: how much of the 254-edge graph each method keeps. The statistical methods range from a handful of edges to most of the graph at the same alpha, because their null models differ.
p = style.palette()
order = sorted(counts, key=lambda n: counts[n].edges_kept)
family_color = dict.fromkeys(statistical, p.categorical[0]) | dict.fromkeys(
    structural, p.categorical[1]
)
fig, ax = plt.subplots(figsize=(7.5, 0.26 * len(order) + 1.0), layout="constrained")
bars = ax.barh(
    order,
    [counts[n].edges_kept for n in order],
    height=0.6,
    color=[family_color[n] for n in order],
)
ax.bar_label(
    bars,
    labels=[str(counts[n].edges_kept) for n in order],
    padding=3,
    fontsize=8,
    color=p.muted,
)
ax.set_xlim(0, G.number_of_edges())
ax.set_xlabel(f"Edges kept, of {G.number_of_edges()}")
ax.tick_params(axis="y", length=0, labelcolor=p.ink)
ax.grid(axis="x")
ax.spines["left"].set_visible(False)
ax.legend(
    handles=[
        plt.Rectangle((0, 0), 1, 1, color=p.categorical[0], label="Statistical"),
        plt.Rectangle((0, 0), 1, 1, color=p.categorical[1], label="Structural"),
    ],
    loc="lower right",
)
ax.set_title("Edges kept by each method on Les Misérables")
Text(0.0, 1.0, 'Edges kept by each method on Les Misérables')
The same numbers as a table:
print(f"{'Method':<34}{'Edges kept':>12}{'Nodes kept':>12}")
for name in order:
    c = counts[name]
    print(
        f"{name:<34}{c.edges_kept:>7} / {c.edges_total}"
        f"{c.nodes_kept:>6} / {c.nodes_total}"
    )
Method                              Edges kept  Nodes kept
gloss_filter                            3 / 254     6 / 77
disparity_filter                        9 / 254    10 / 77
polya_filter                           12 / 254    14 / 77
h_backbone                             18 / 254    17 / 77
glab_filter                            56 / 254    57 / 77
primary_linkage_analysis               69 / 254    77 / 77
ecm_filter                             72 / 254    63 / 77
modularity_backbone                    72 / 254    44 / 77
high_salience_skeleton                 76 / 254    77 / 77
maximum_spanning_tree_backbone         76 / 254    77 / 77
edge_betweenness_filter                77 / 254    77 / 77
global_sparsification                 102 / 254    42 / 77
lans_filter                           109 / 254    77 / 77
doubly_stochastic_filter              109 / 254    77 / 77
ultrametric_backbone                  118 / 254    77 / 77
noise_corrected_filter                126 / 254    71 / 77
marginal_likelihood_filter            126 / 254    71 / 77
strongest_n_ties                      146 / 254    77 / 77
global_threshold_filter               157 / 254    58 / 77
planar_maximally_filtered_graph       162 / 254    77 / 77
metric_backbone                       163 / 254    77 / 77
multiple_linkage_analysis             205 / 254    77 / 77
node_degree_filter                    237 / 254    60 / 77
Total running time of the script: (0 minutes 3.300 seconds)