Workflow#
This guide explains the canonical workflow for extracting a backbone from a network.
The score-then-filter pattern#
Most backbone methods follow a two-step process:
Apply a backbone method to the original graph. This returns a copy of the graph with a new edge attribute containing a score (p-value, similarity coefficient, salience, etc.).
Apply a filter from the
filtersmodule to select the edges that form the backbone.
import networkx as nx
import networkx_backbone as nb

G = nx.les_miserables_graph()

# Step 1: Score
H = nb.disparity_filter(G)

# Step 2: Filter
backbone = nb.threshold_filter(H, "disparity_pvalue", 0.05)
Score attributes by method#
Each method adds a specific edge attribute to the returned graph. Use this attribute name when calling a filter function.
Method |
Edge Attribute |
Interpretation |
|---|---|---|
|
p-value (lower = more significant) |
|
|
z-score (higher = more significant) |
|
|
p-value (lower = more significant) |
|
|
p-value (lower = more significant) |
|
|
p-value (lower = more significant) |
|
|
p-value + boolean keep flag |
|
|
Boolean keep flag |
|
|
Boolean keep flag |
|
|
Boolean keep flag |
|
|
Boolean keep flag |
|
|
centrality score + boolean keep flag |
|
|
Boolean keep flag |
|
|
Fraction in [0, 1] (higher = more important) |
|
|
Boolean keep flag |
|
|
Boolean keep flag |
|
|
Normalized weight (higher = more important) |
|
|
Boolean keep flag |
|
|
p-value (lower = more significant) |
|
|
Count (higher = more embedded) |
|
|
Coefficient in [0, 1] (higher = more embedded) |
|
|
Coefficient in [0, 1] (higher = more embedded) |
|
|
Coefficient in [0, 1] (higher = more embedded) |
|
|
Index (higher = more embedded) |
|
|
Index (higher = more embedded) |
|
|
Index (higher = more embedded) |
|
|
Score (higher = more expected) |
|
|
Score (higher = more embedded) |
|
|
Score (higher = more embedded) |
|
|
Reciprocal distance (higher = closer) |
|
|
Score (higher = more embedded) |
|
|
score + boolean keep flag |
|
|
p-value (lower = more significant) |
|
|
p-value (lower = more significant) |
|
|
node score + boolean keep flag |
Filtering functions#
The filters module provides filtering functions and
graph-preparation support utilities.
multigraph_to_weighted()Convert
MultiGraph/MultiDiGraphinputs into weighted simple graphs by collapsing parallel edges. Useedge_type_attrto count distinct edge types per node pair:weighted_simple = nb.multigraph_to_weighted(MG, edge_type_attr="edge_type")
The high-level
backbone_from_weighted()wrapper applies this conversion automatically for multigraph inputs by default.threshold_filter()Keep edges where the score is below (for p-values) or above (for importance scores) a given threshold. Use
mode="below"for p-values andmode="above"for importance scores. By default, all input nodes are kept; setinclude_all_nodes=Falseto drop isolates:# For p-values (keep low values) backbone = nb.threshold_filter(H, "disparity_pvalue", 0.05) # For scores (keep high values) backbone = nb.threshold_filter(H, "salience", 0.5, mode="above") # Optionally remove isolate nodes after edge filtering backbone = nb.threshold_filter(H, "disparity_pvalue", 0.05, include_all_nodes=False)
fraction_filter()Keep a fixed fraction of edges, sorted by score. Use
ascending=Trueto keep the smallest scores (p-values) orascending=Falseto keep the largest scores:# Keep the 20% most significant edges backbone = nb.fraction_filter(H, "disparity_pvalue", 0.2, ascending=True)
boolean_filter()Keep edges where a boolean attribute is truthy:
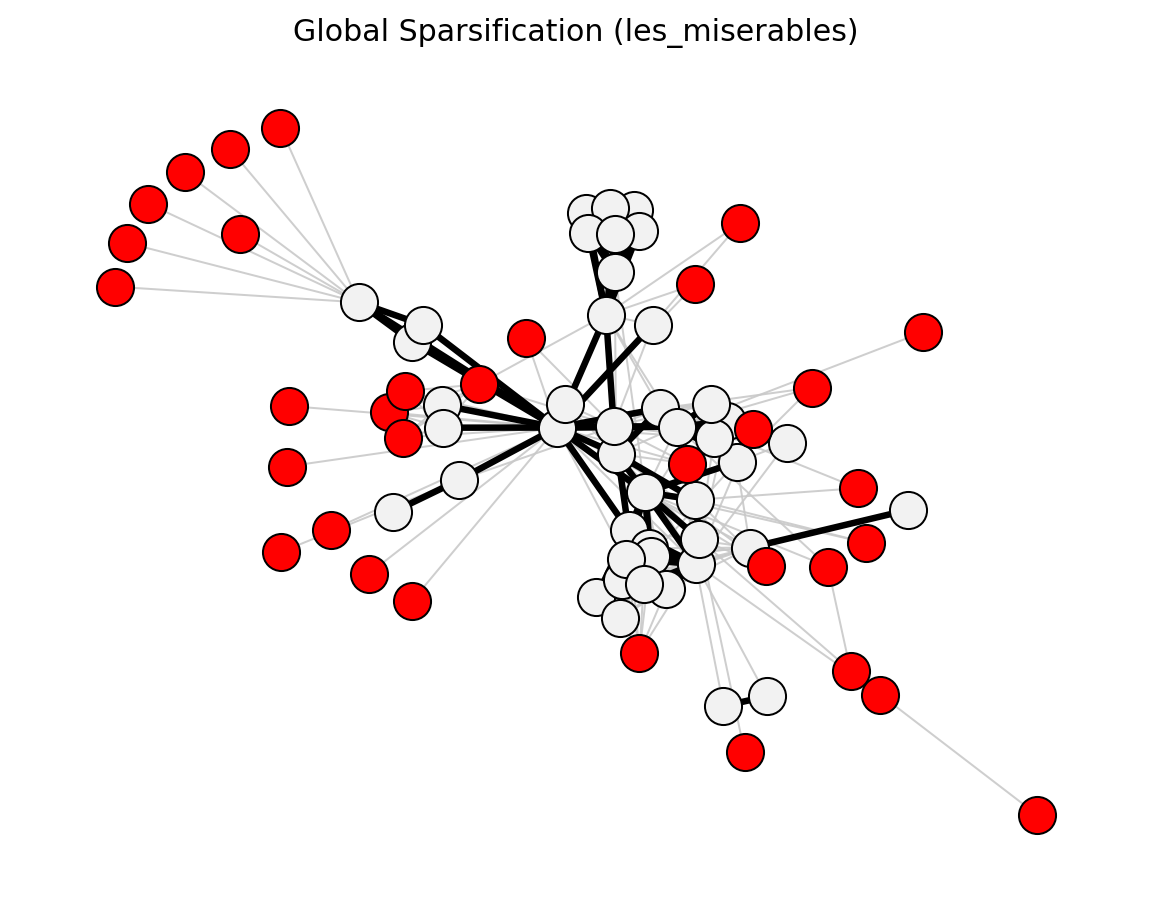
H = nb.global_sparsification(G, s=0.4)
backbone = nb.boolean_filter(H, "global_sparsification_keep")
consensus_backbone()Take the intersection of multiple backbones – only edges present in all input backbones are kept:
b1 = nb.threshold_filter(nb.disparity_filter(G), "disparity_pvalue", 0.05)
b2 = nb.boolean_filter(nb.metric_backbone(G), "metric_keep")
consensus = nb.consensus_backbone(b1, b2)
Visual comparison#
Use visualization helpers to compare an original
graph with a backbone and highlight dropped structure:
backbone = nb.threshold_filter(
    nb.disparity_filter(G), "disparity_pvalue", 0.05, include_all_nodes=False
)
fig, ax, diff = nb.compare_graphs(G, backbone, return_diff=True)
print(f"Removed nodes: {len(diff['removed_nodes'])}")
Methods with boolean keep flags#
Several methods provide built-in boolean edge attributes specifically for
the filter step. Apply boolean_filter() to extract
the final backbone:
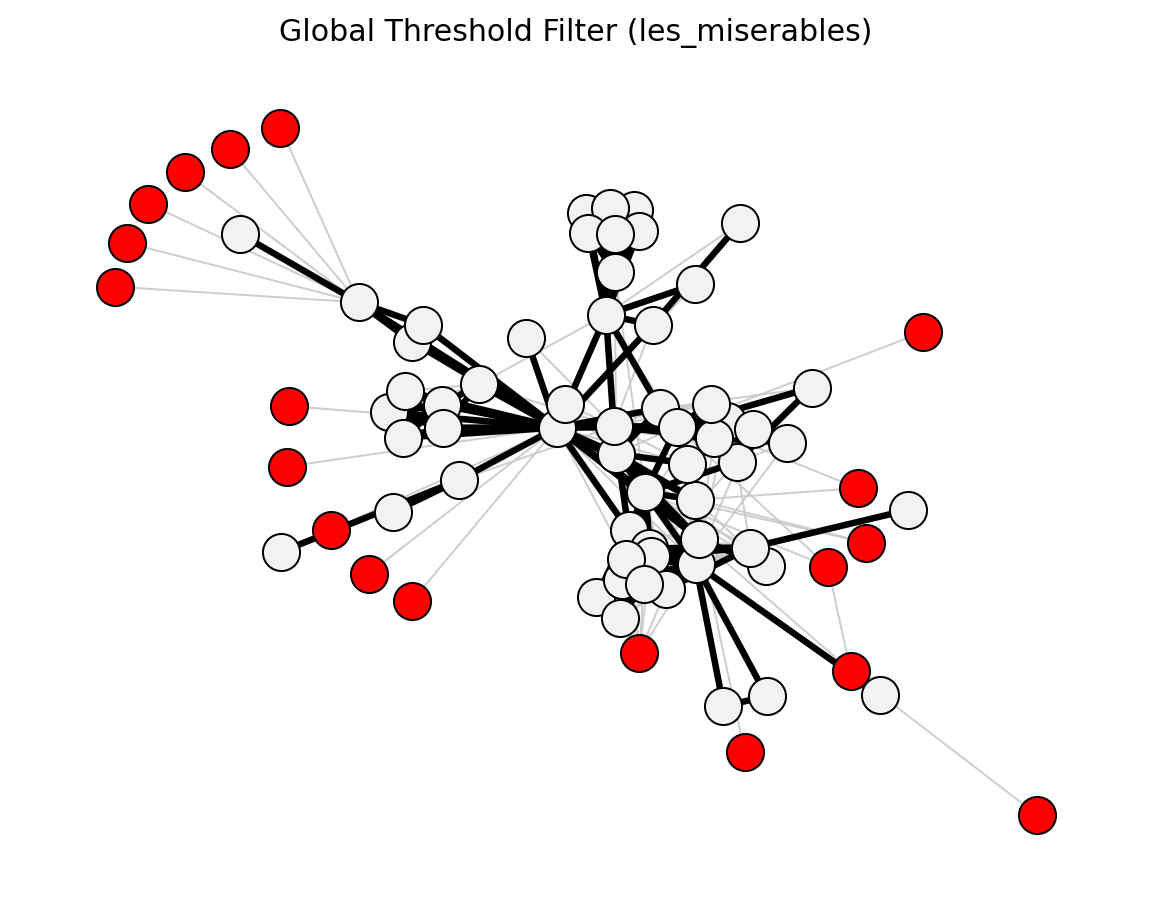
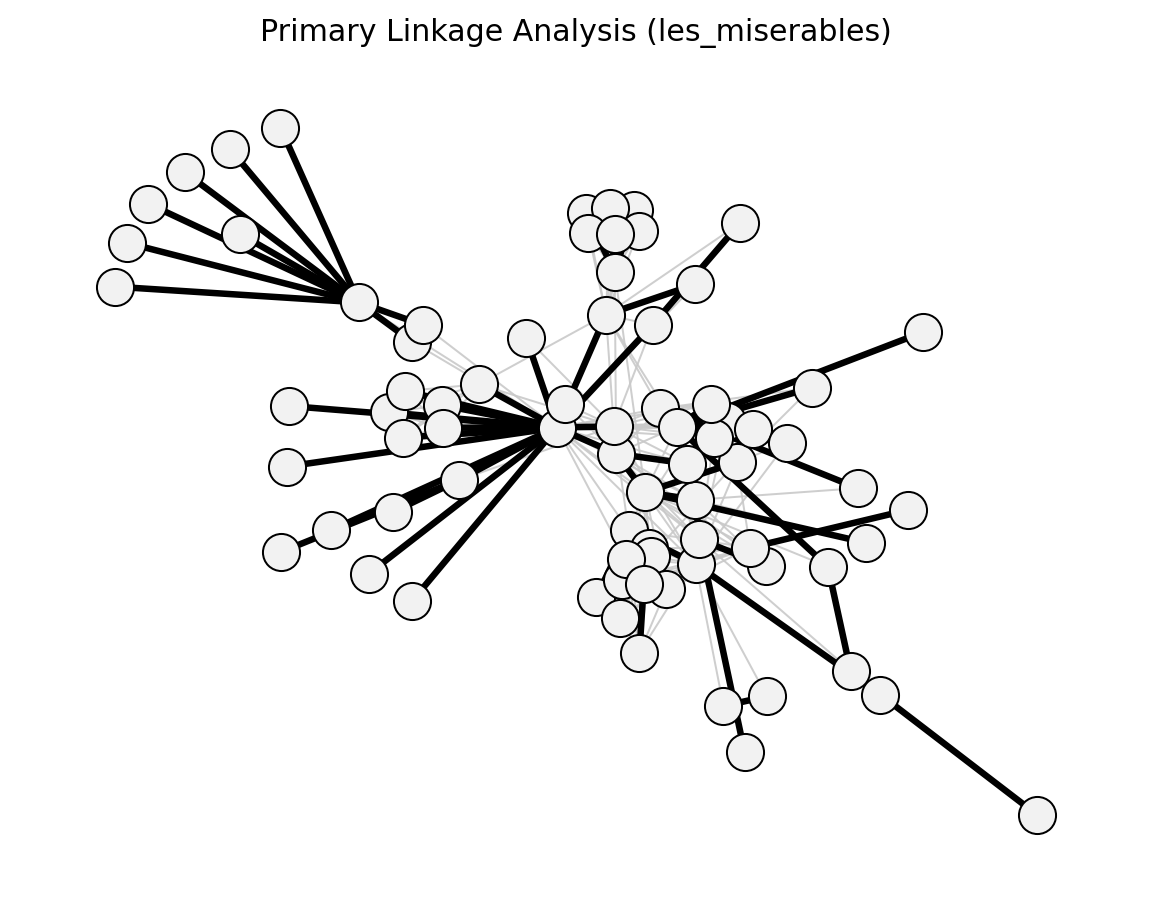
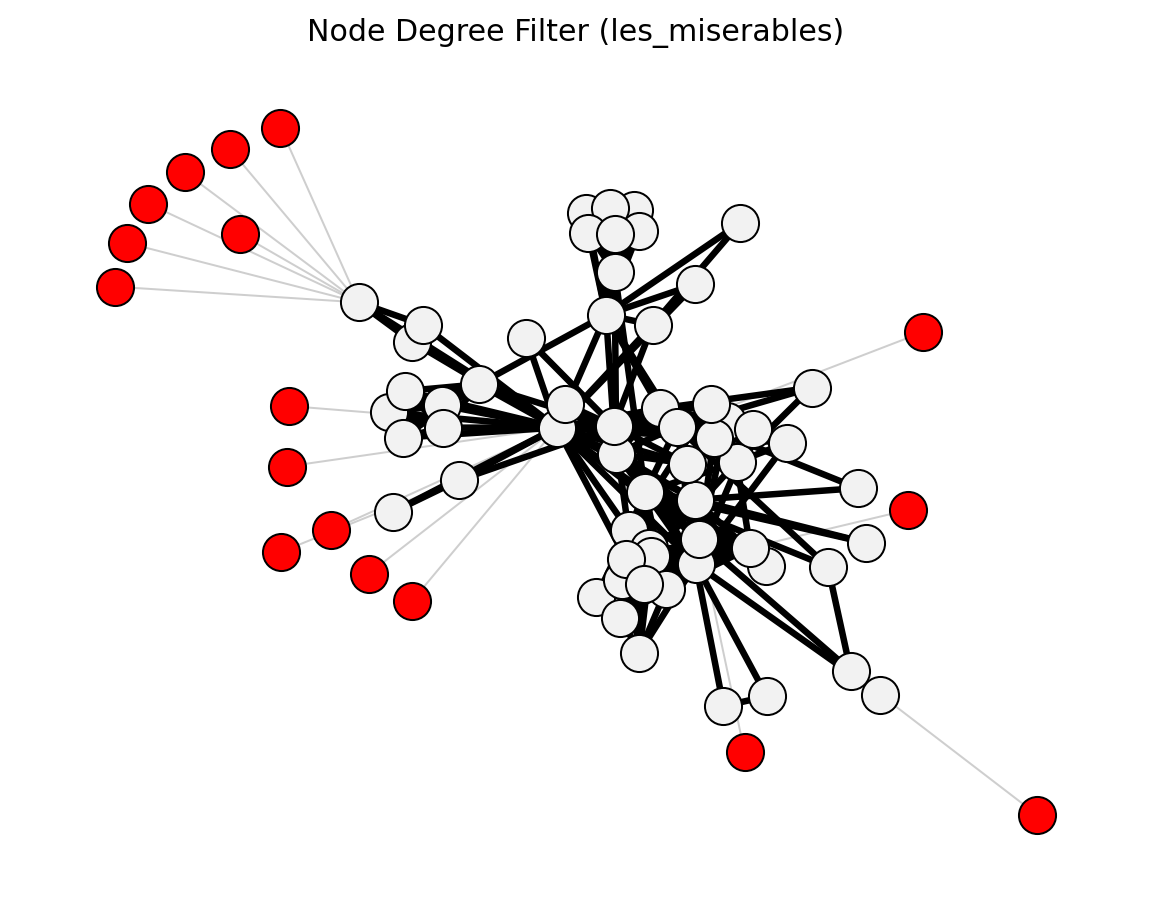
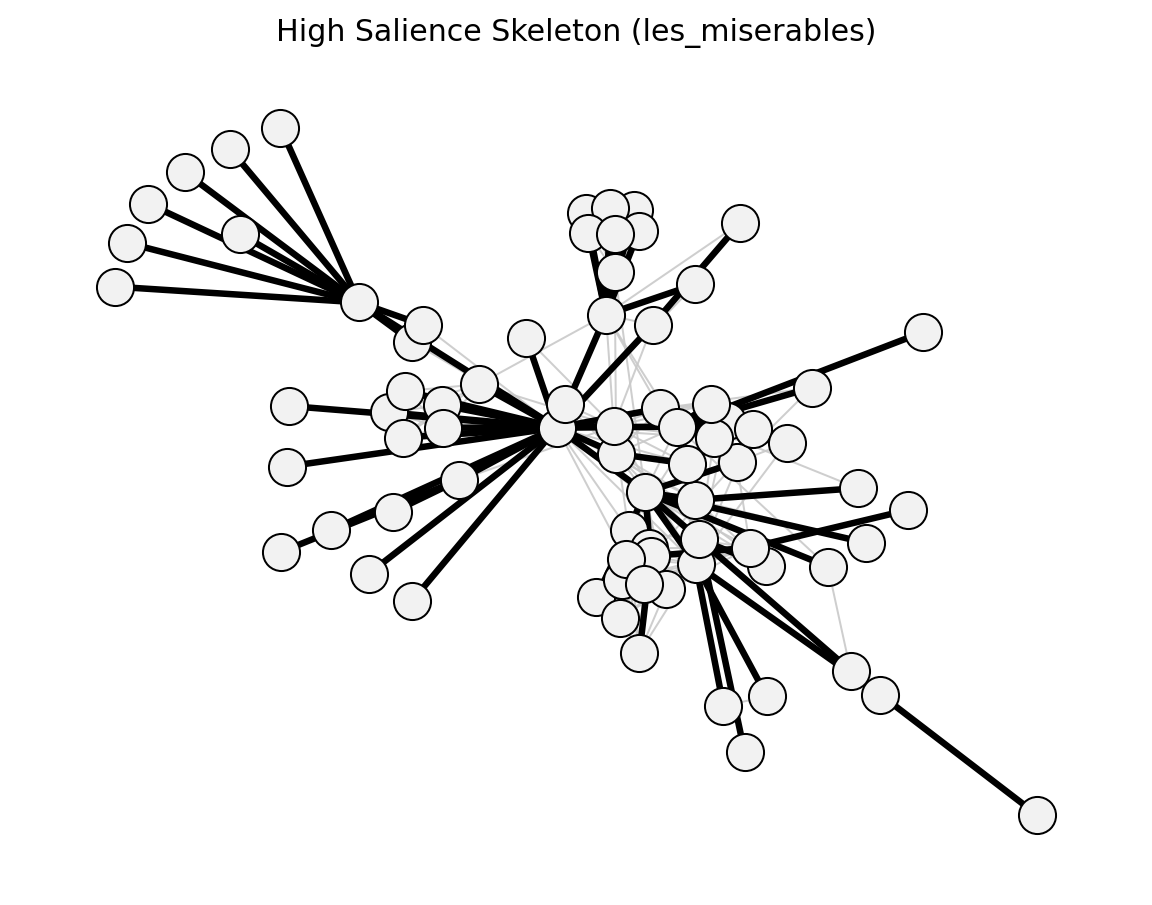
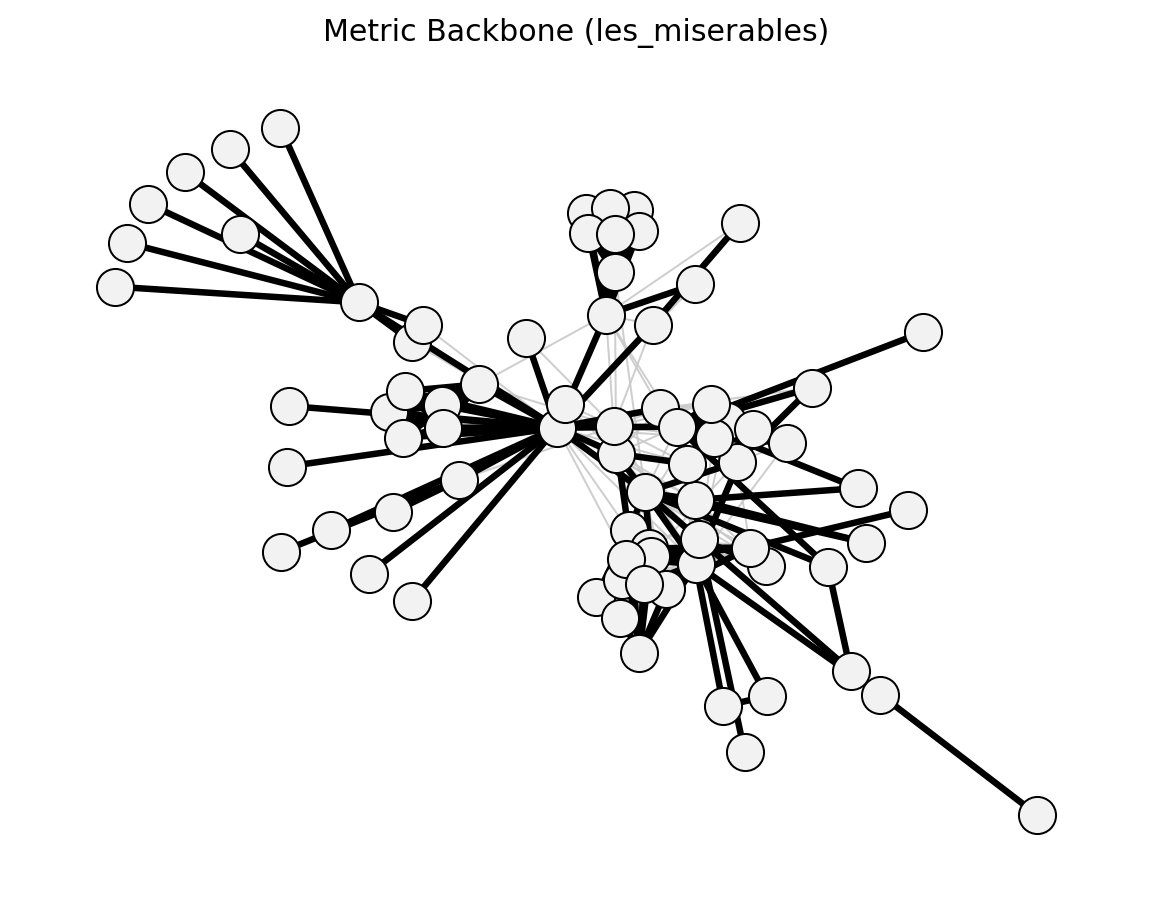
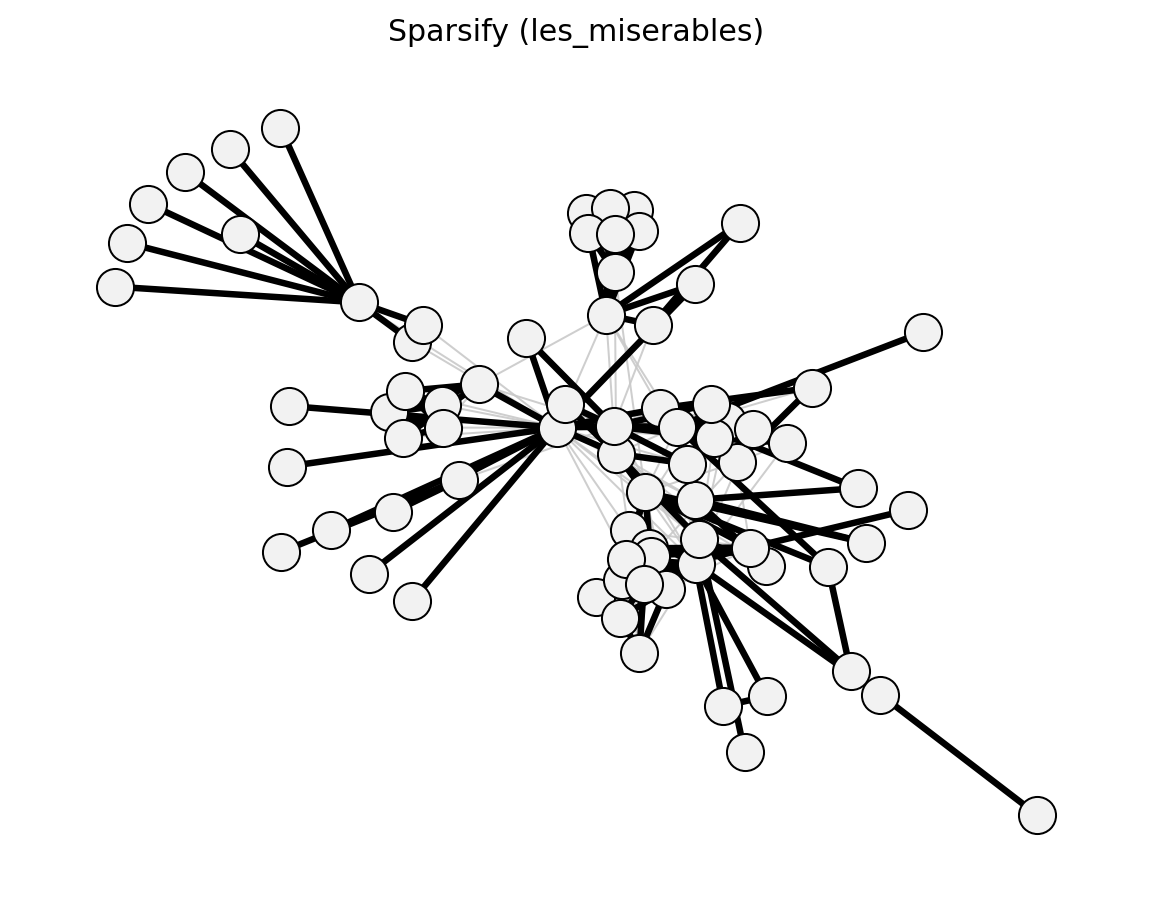
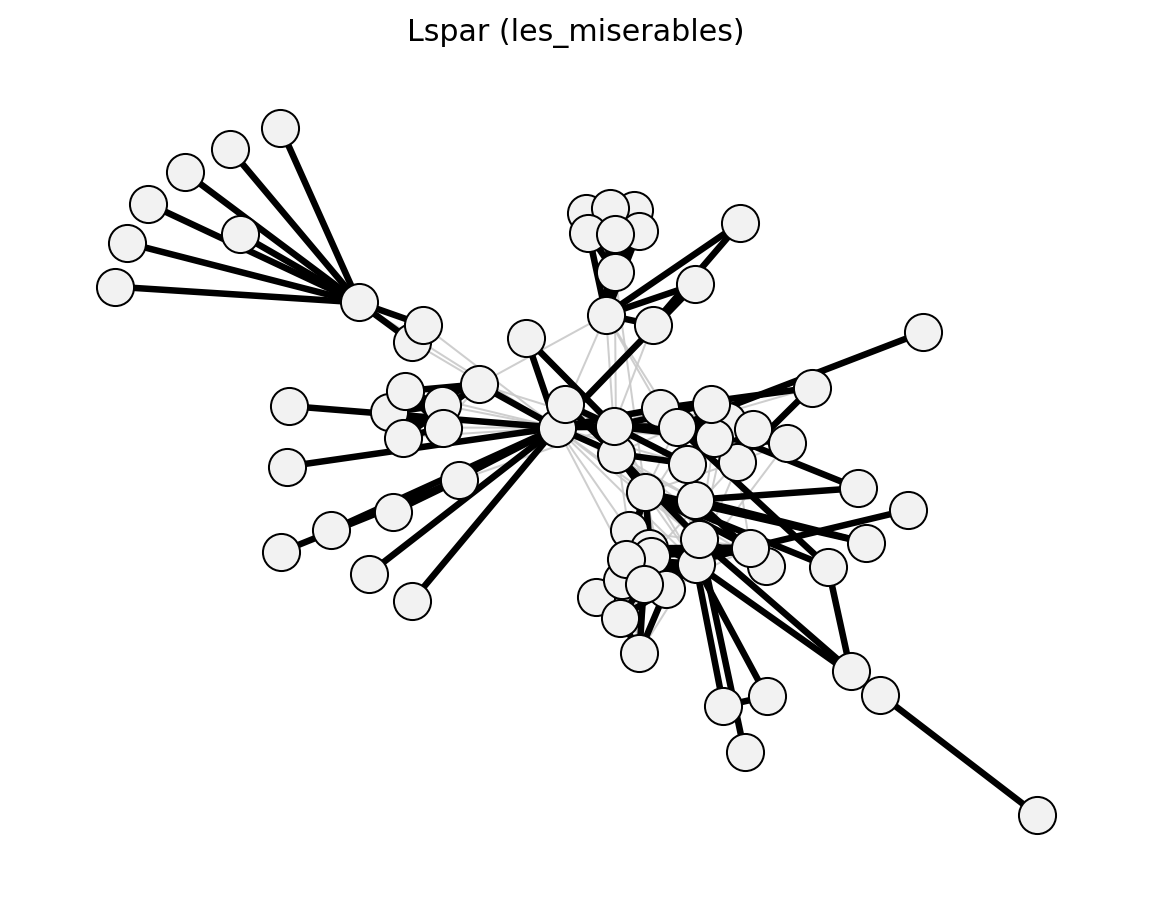
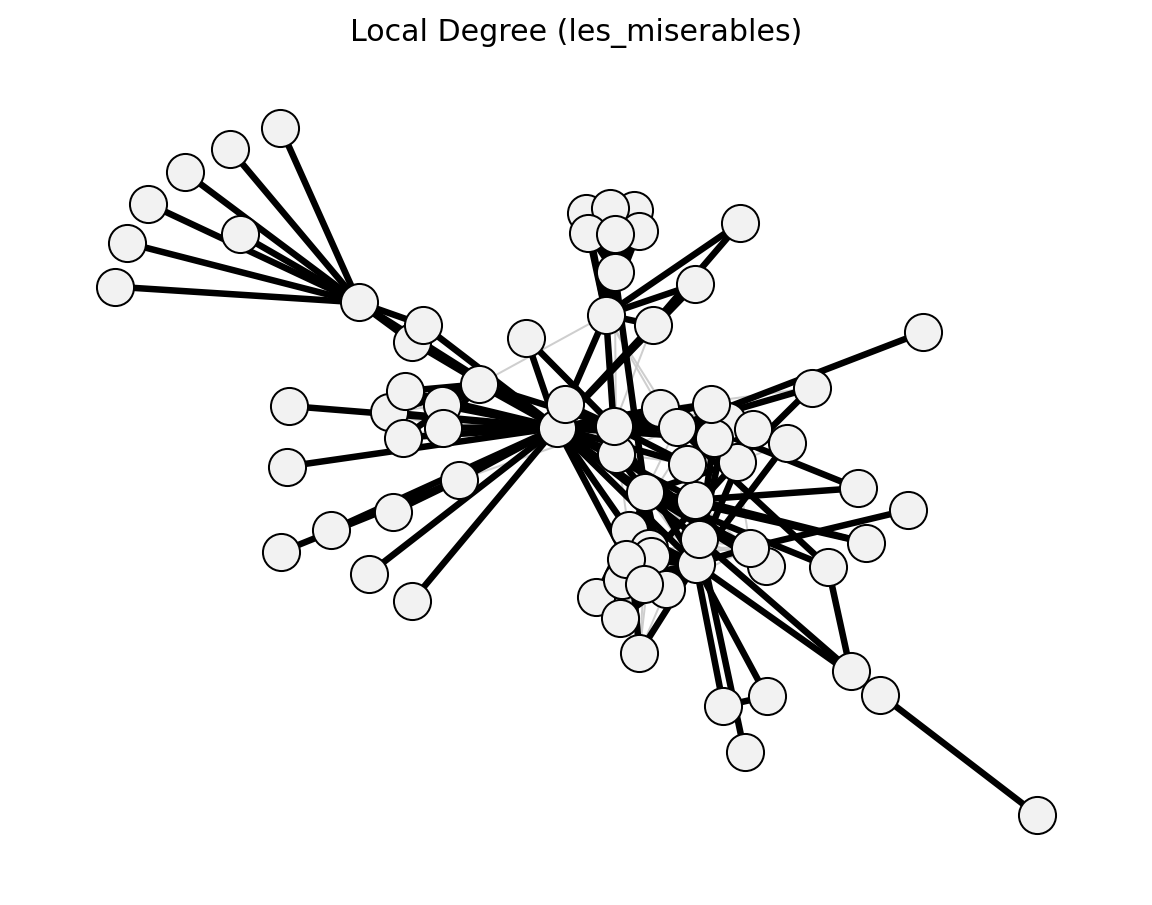
global_threshold_filter()->global_threshold_keepstrongest_n_ties()->strongest_n_ties_keepglobal_sparsification()->global_sparsification_keepprimary_linkage_analysis()->primary_linkage_keepedge_betweenness_filter()->edge_betweenness_keepnode_degree_filter()->node_degree_keepmetric_backbone()->metric_keepultrametric_backbone()->ultrametric_keeph_backbone()->h_backbone_keepmodularity_backbone()->modularity_keepplanar_maximally_filtered_graph()->pmfg_keepmaximum_spanning_tree_backbone()->mst_keepmultiple_linkage_analysis()->mla_keepsparsify()/lspar()/local_degree()->sparsify_keep
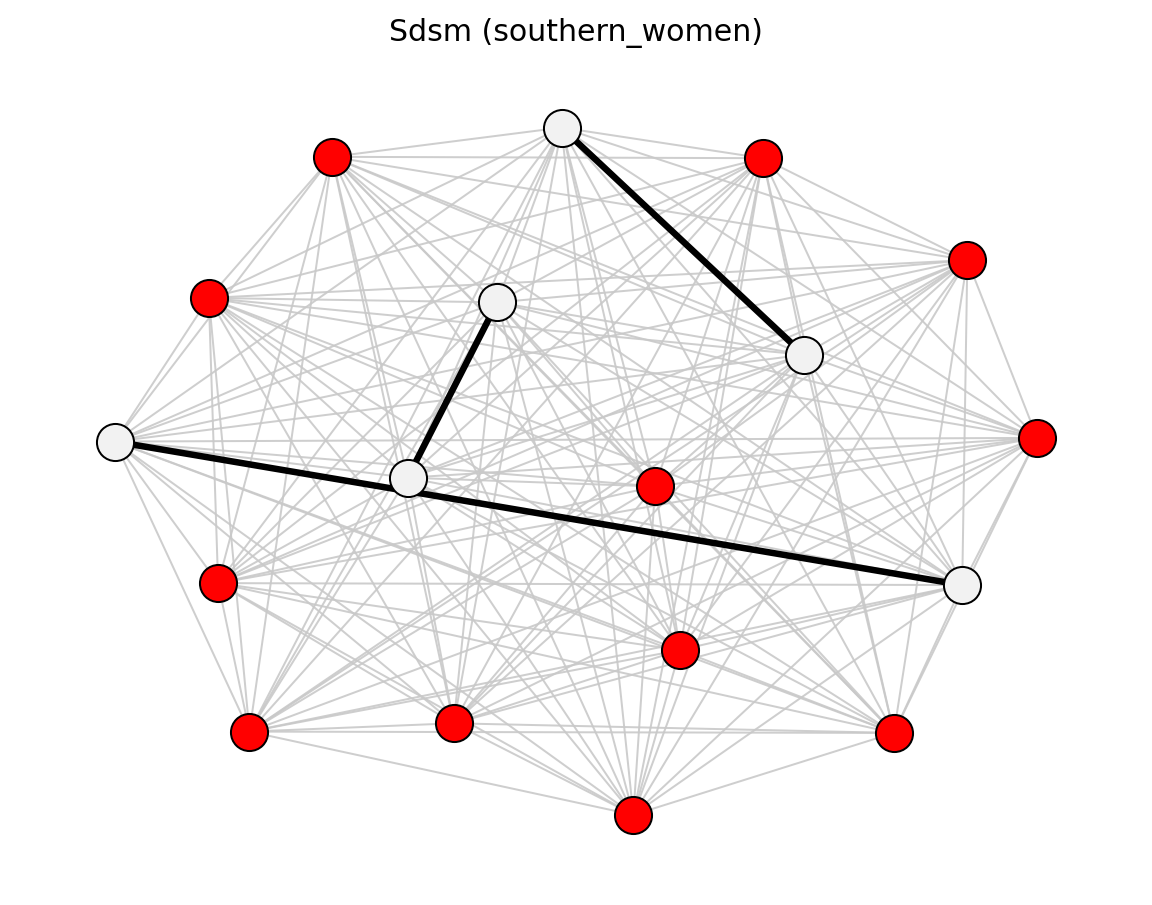
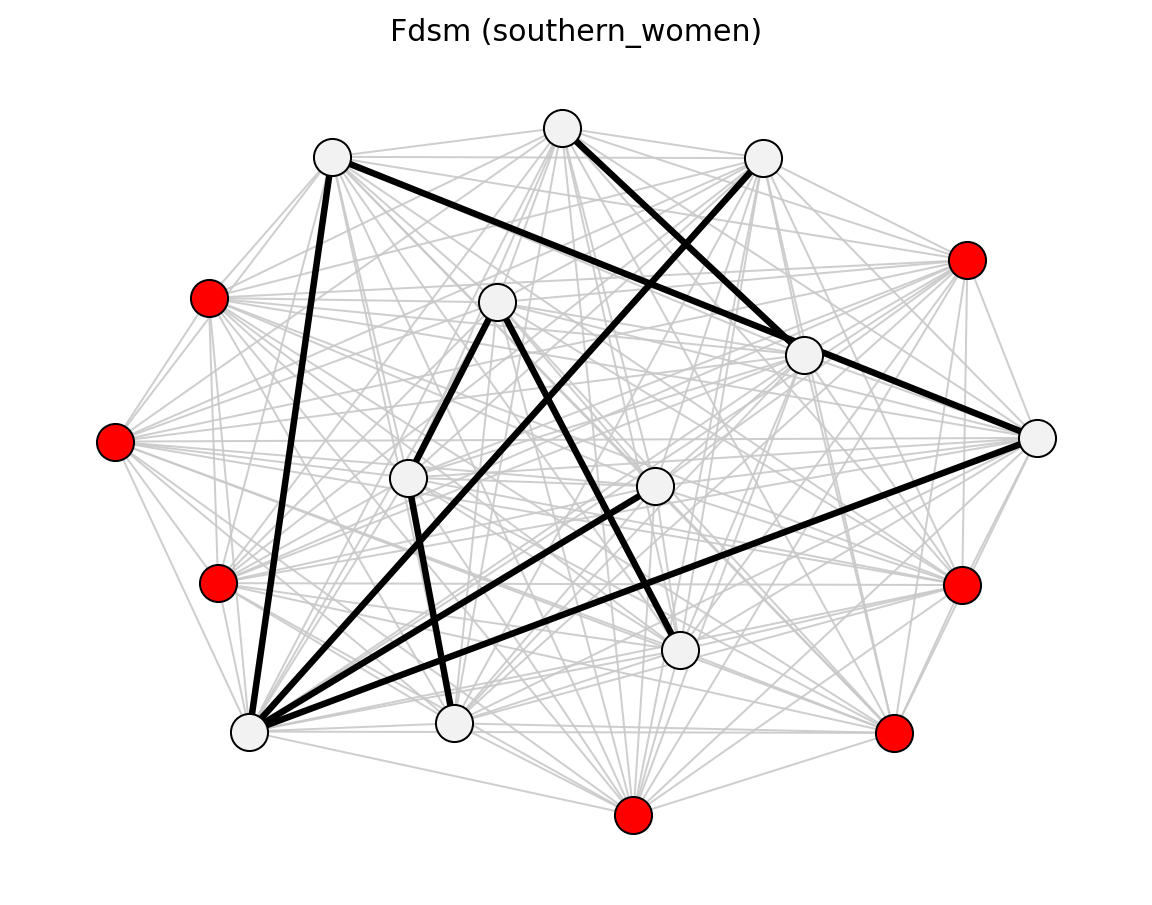
For bipartite projections, sdsm() and
fdsm() return full projected graphs with p-values
(sdsm_pvalue / fdsm_pvalue), which you can then filter with
threshold_filter(). Use projection= to attach
simple, hyper, probs, or ycn projection weights.
Function Image Reference#
These static snapshots from docs/_static/graph_gallery/ map functions to
their score-then-filter visual outcomes.
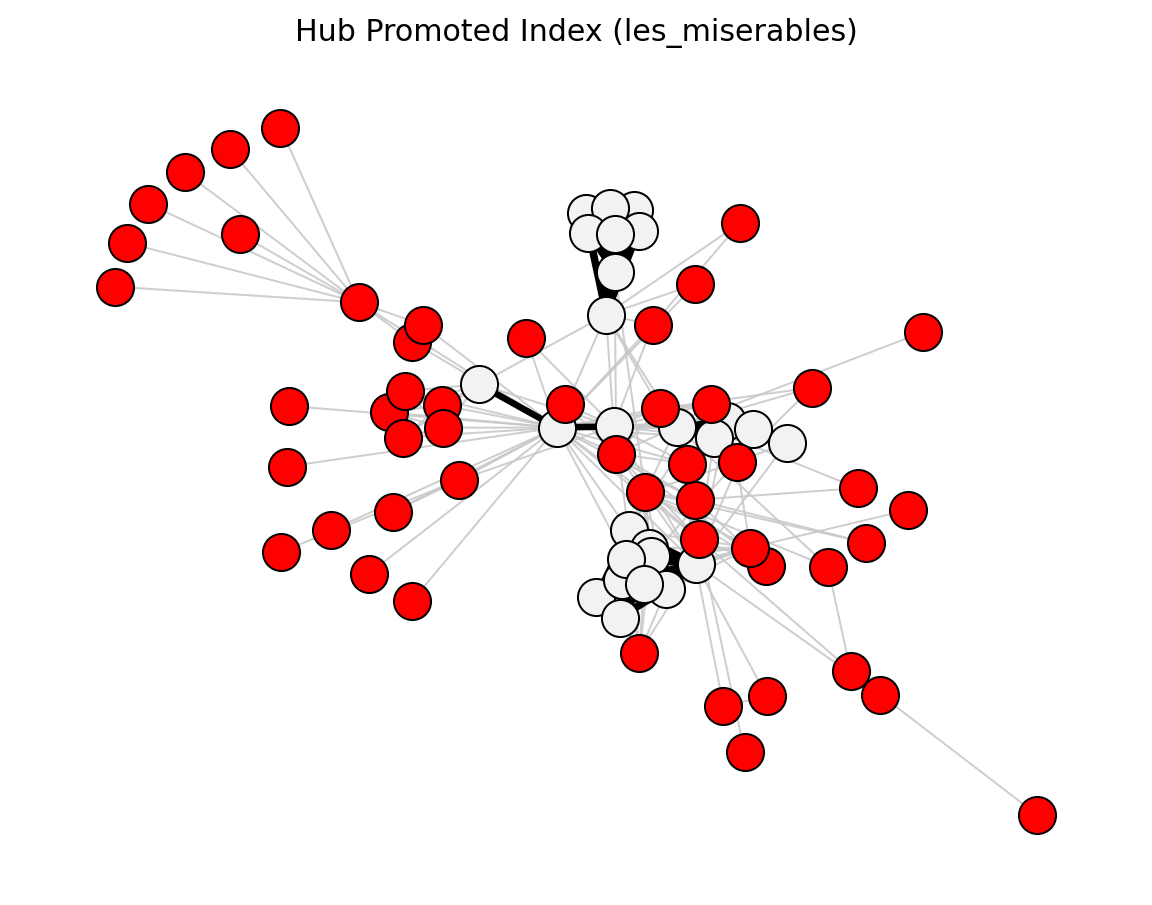
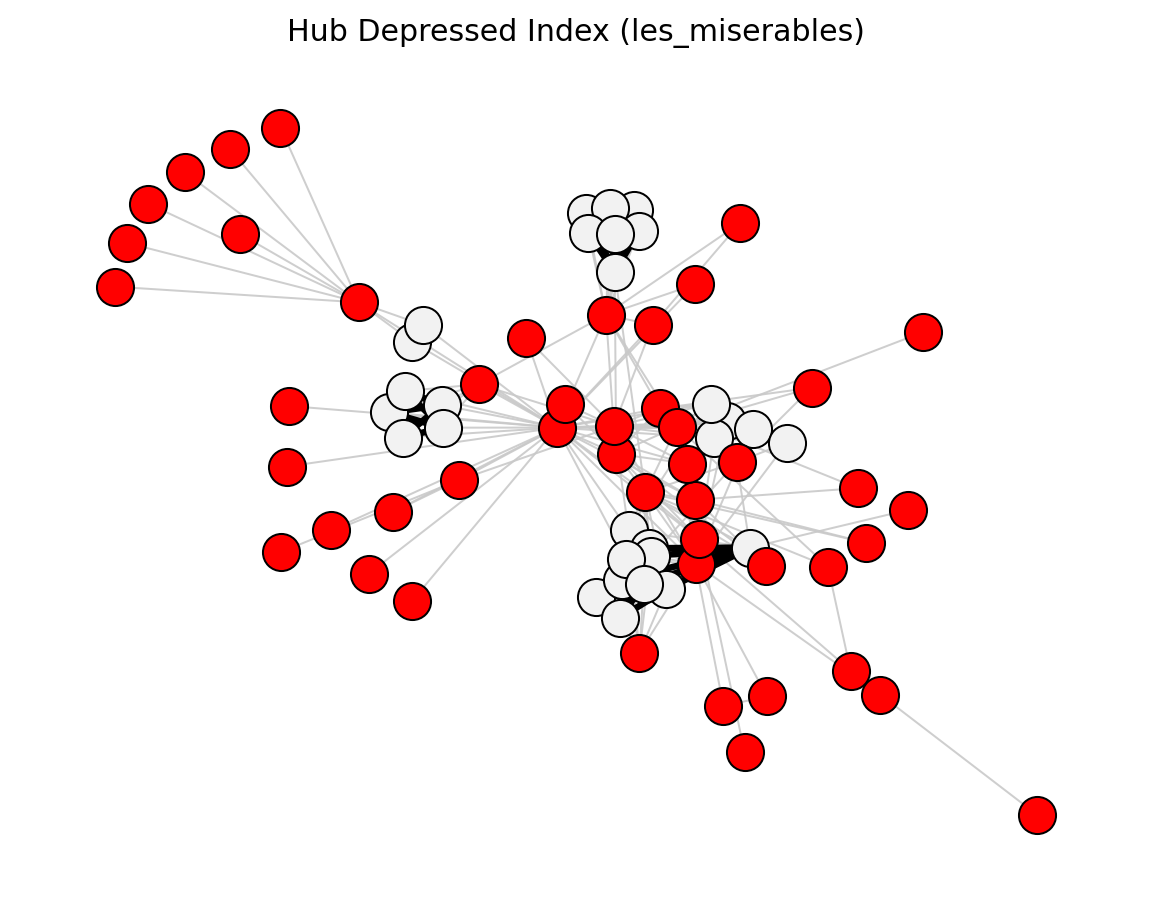
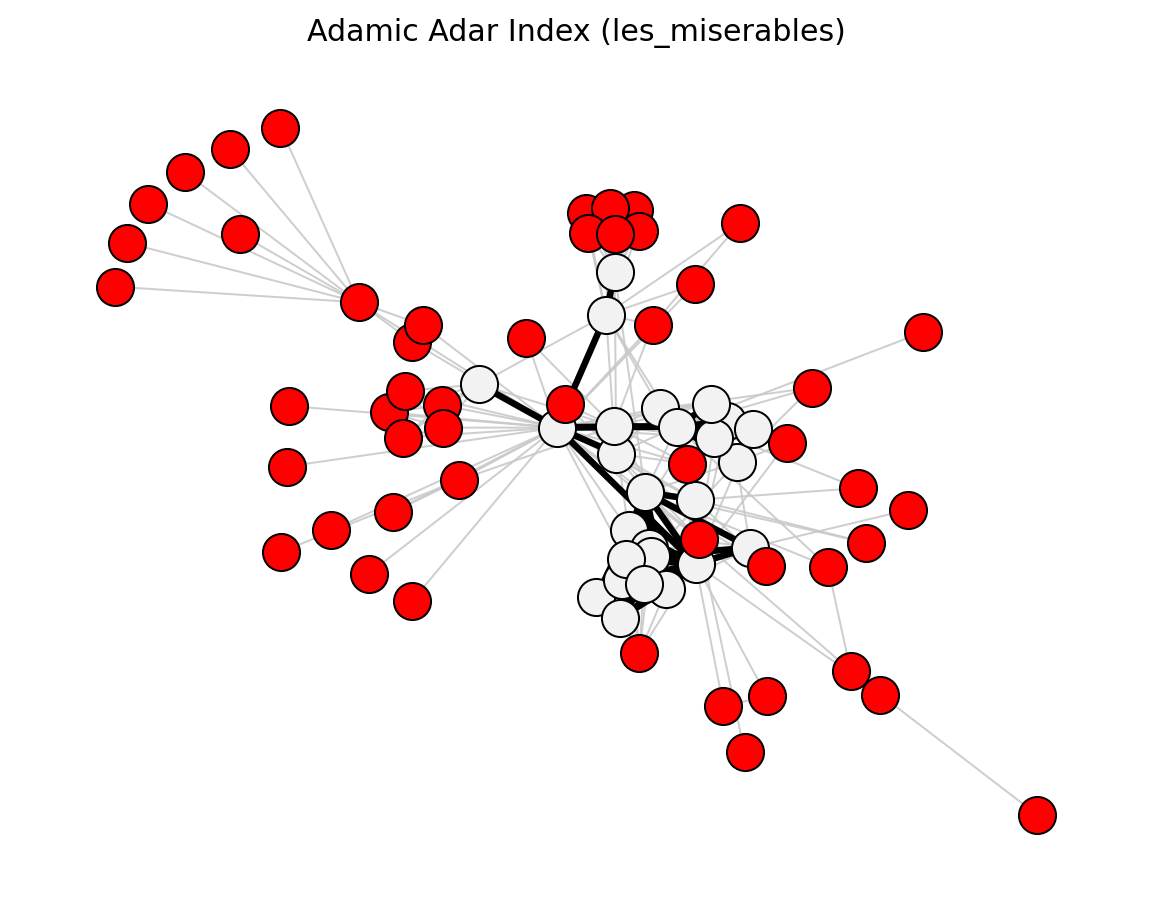
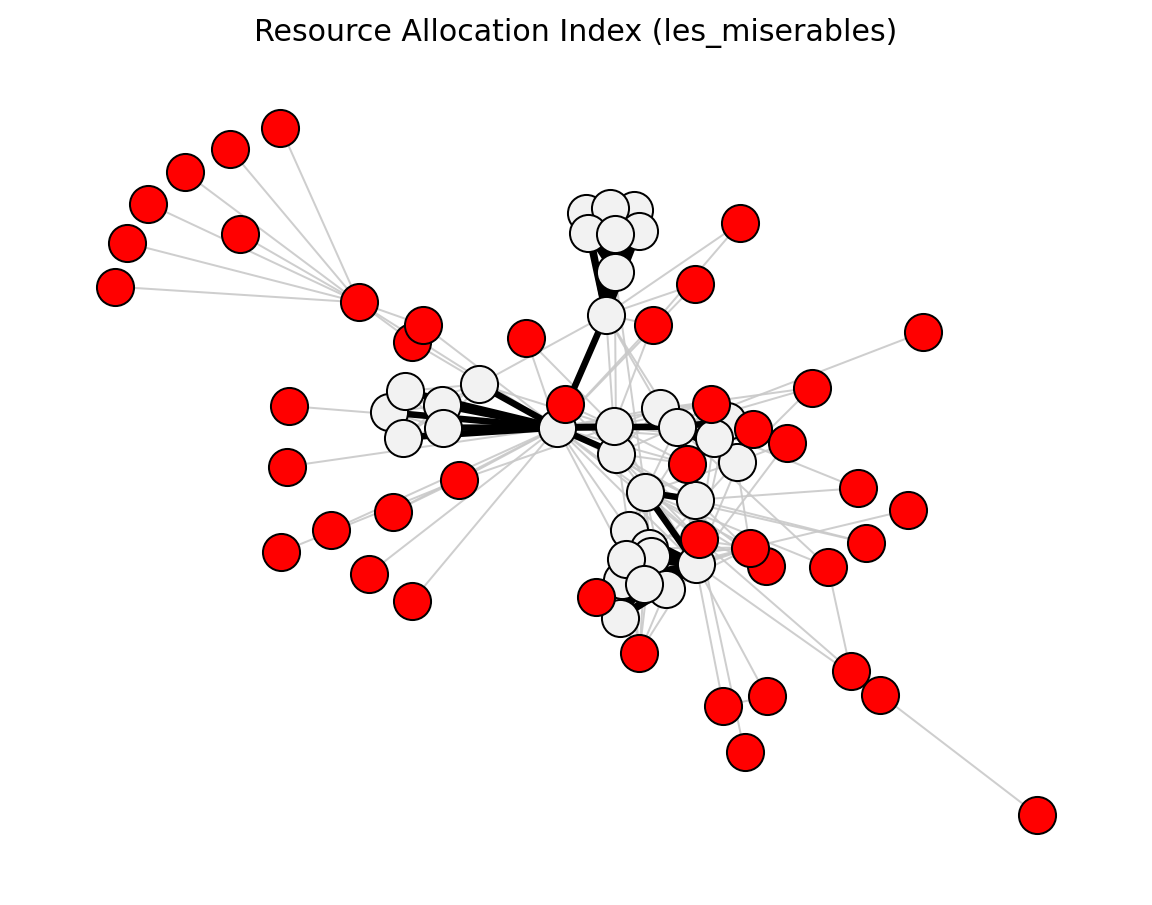
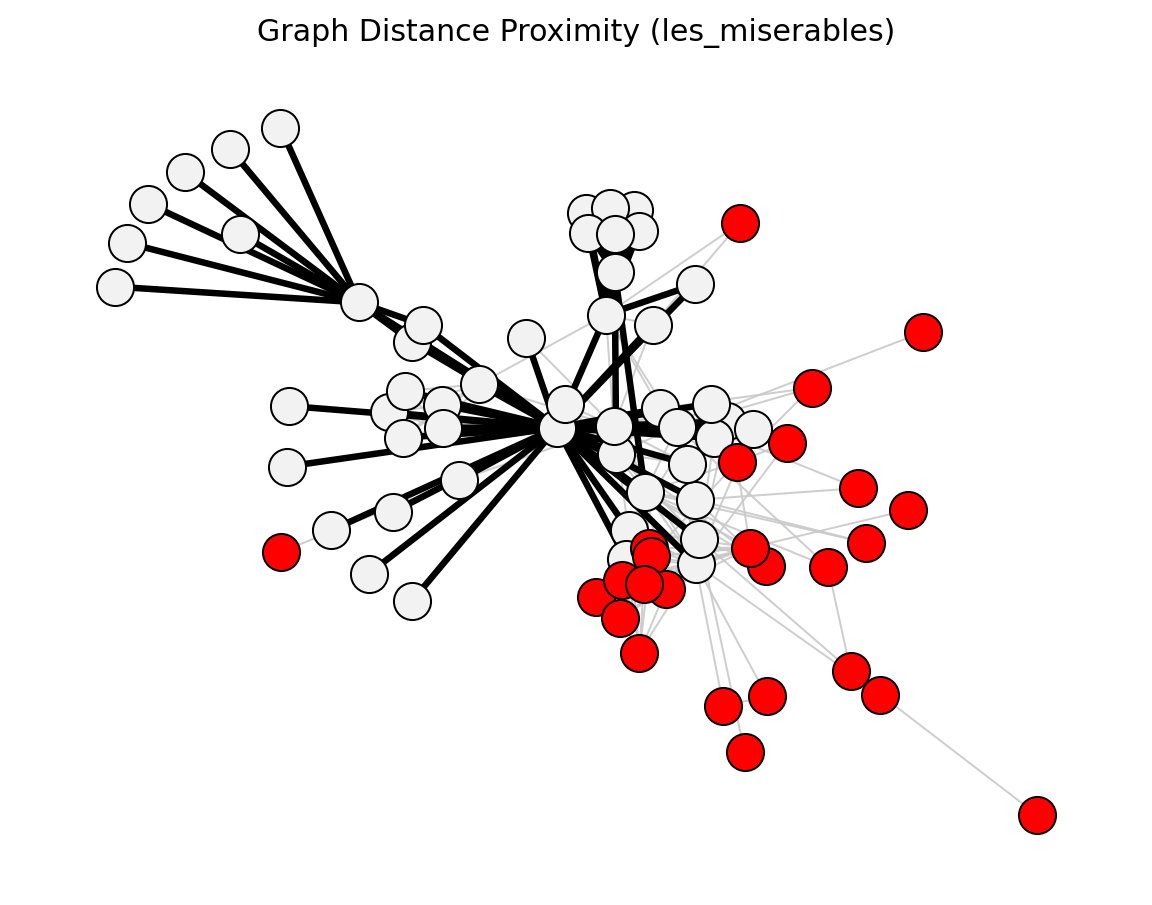
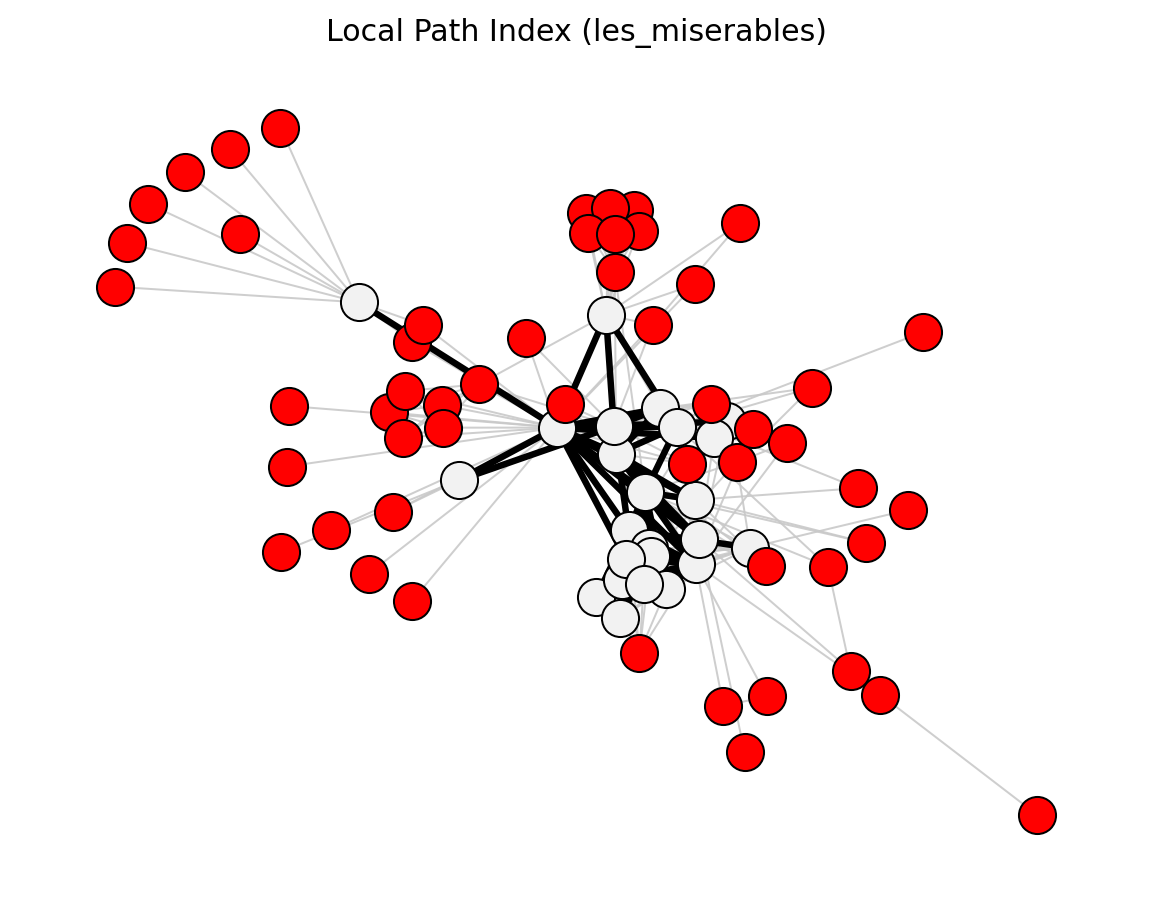
Hybrid (Les Miserables)#
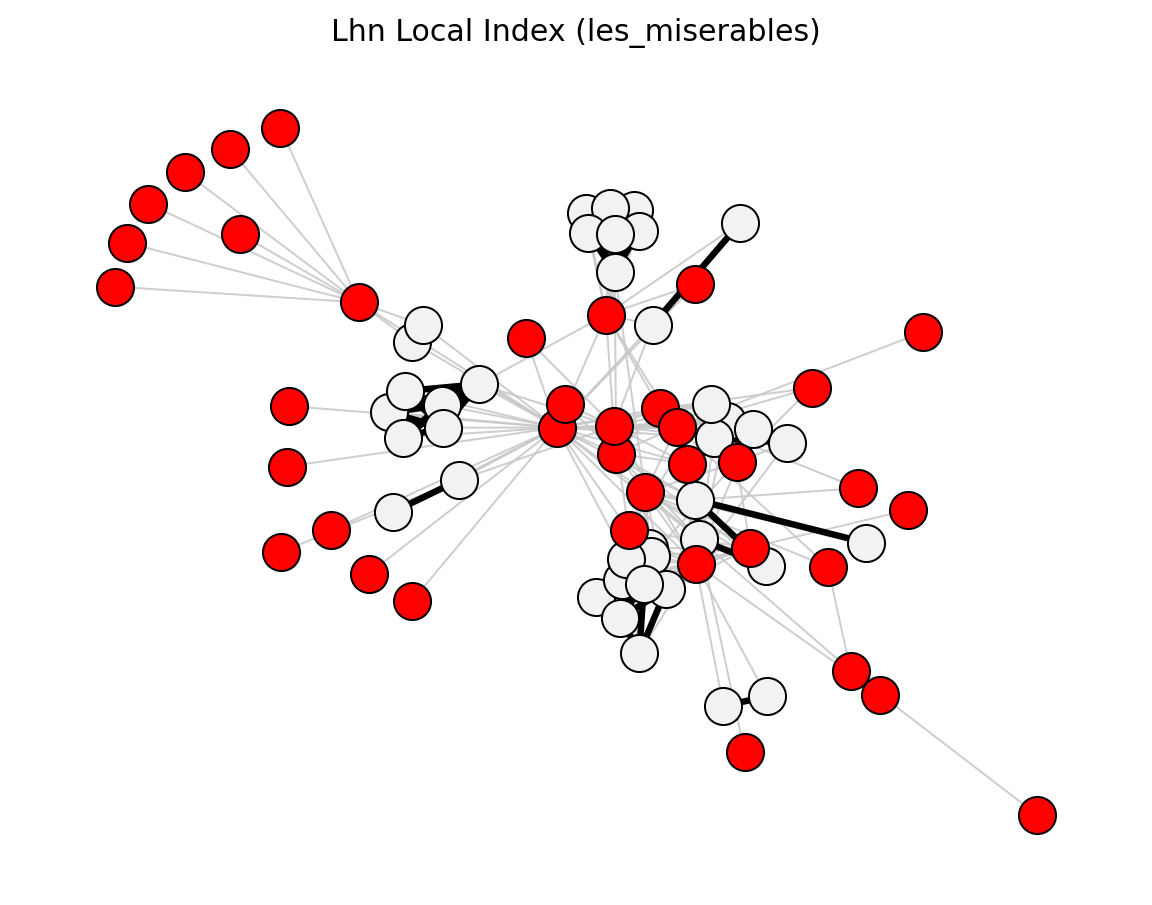
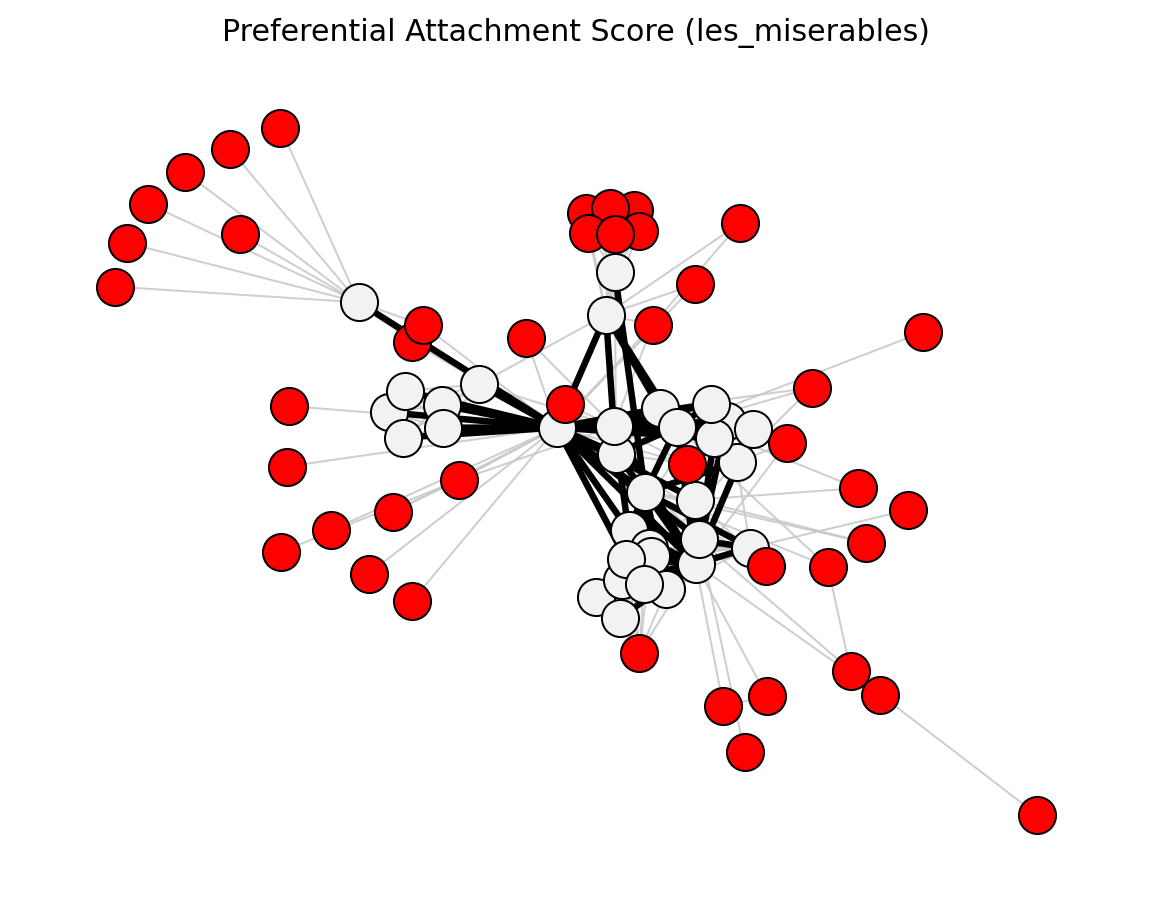
Proximity (Les Miserables)#


preferential_attachment_score()
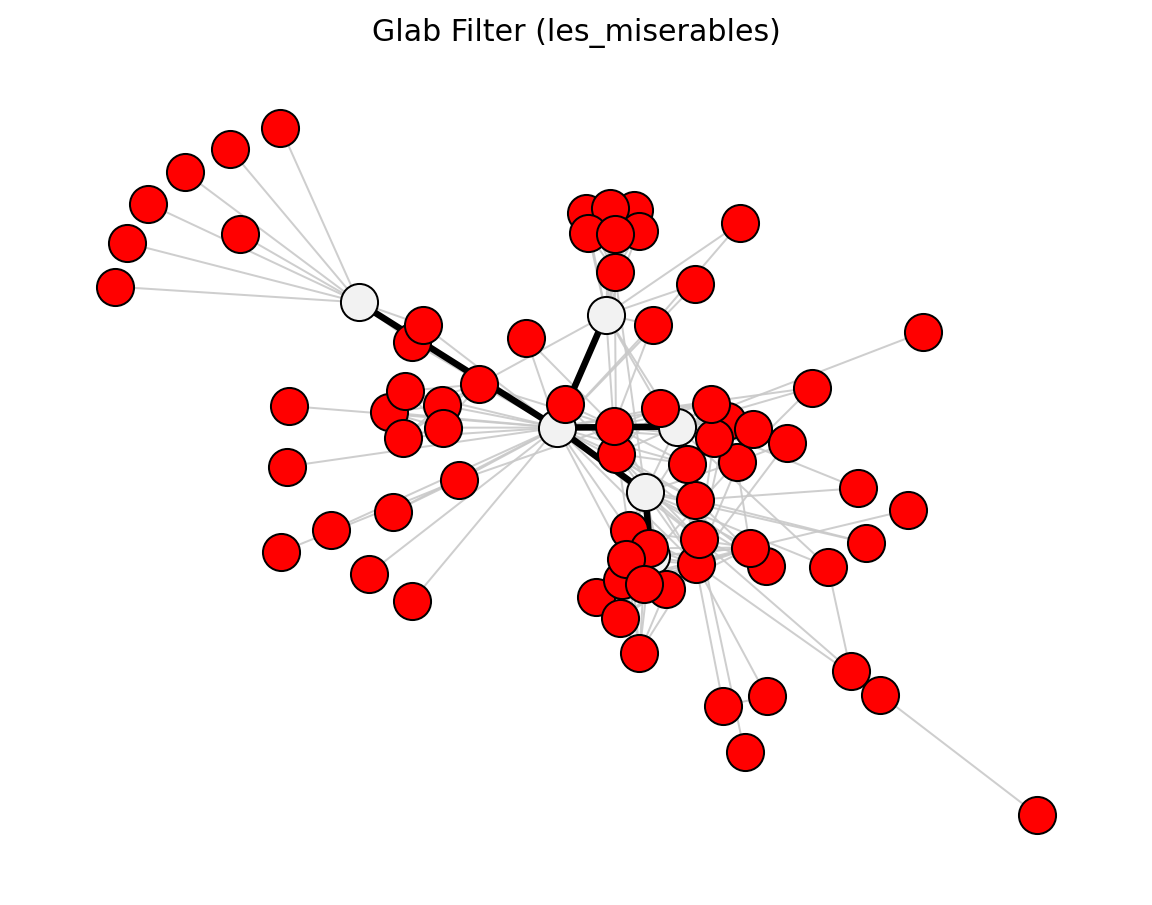
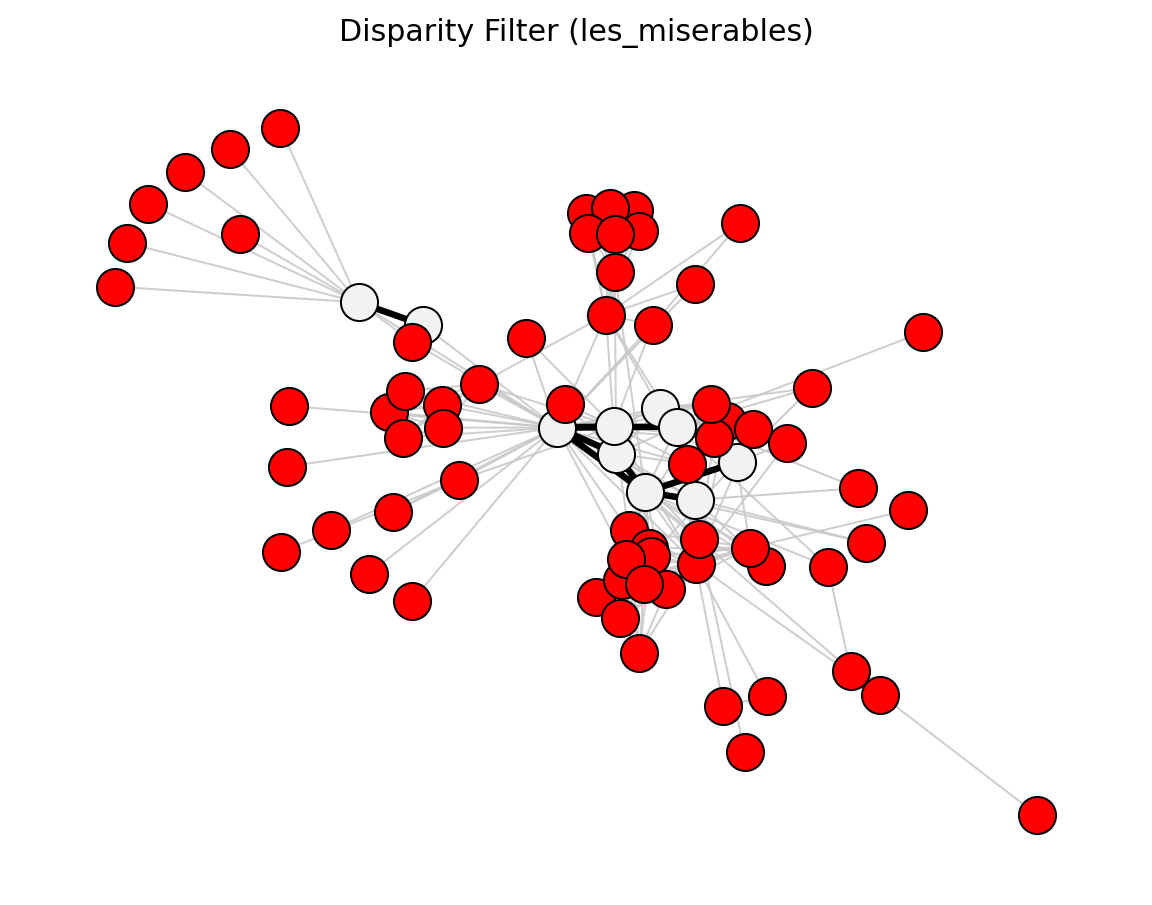
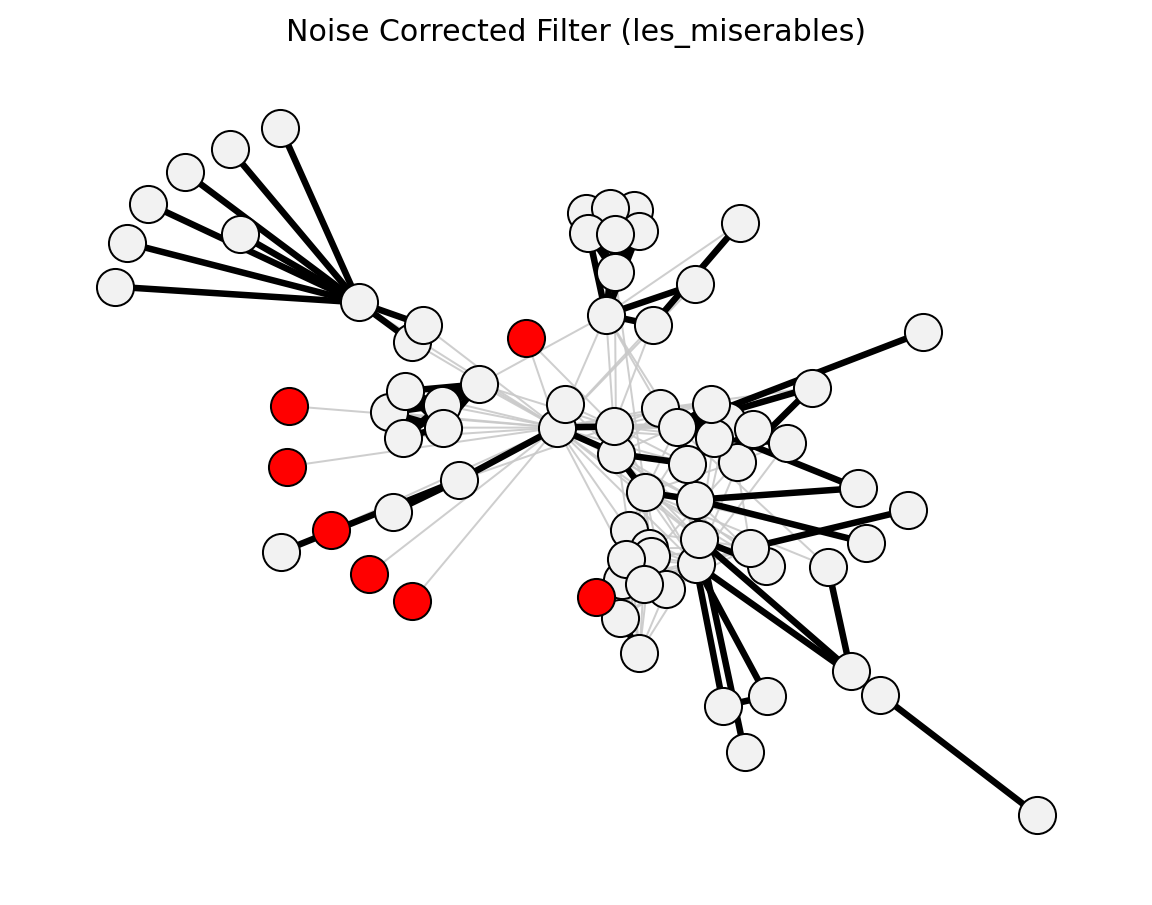
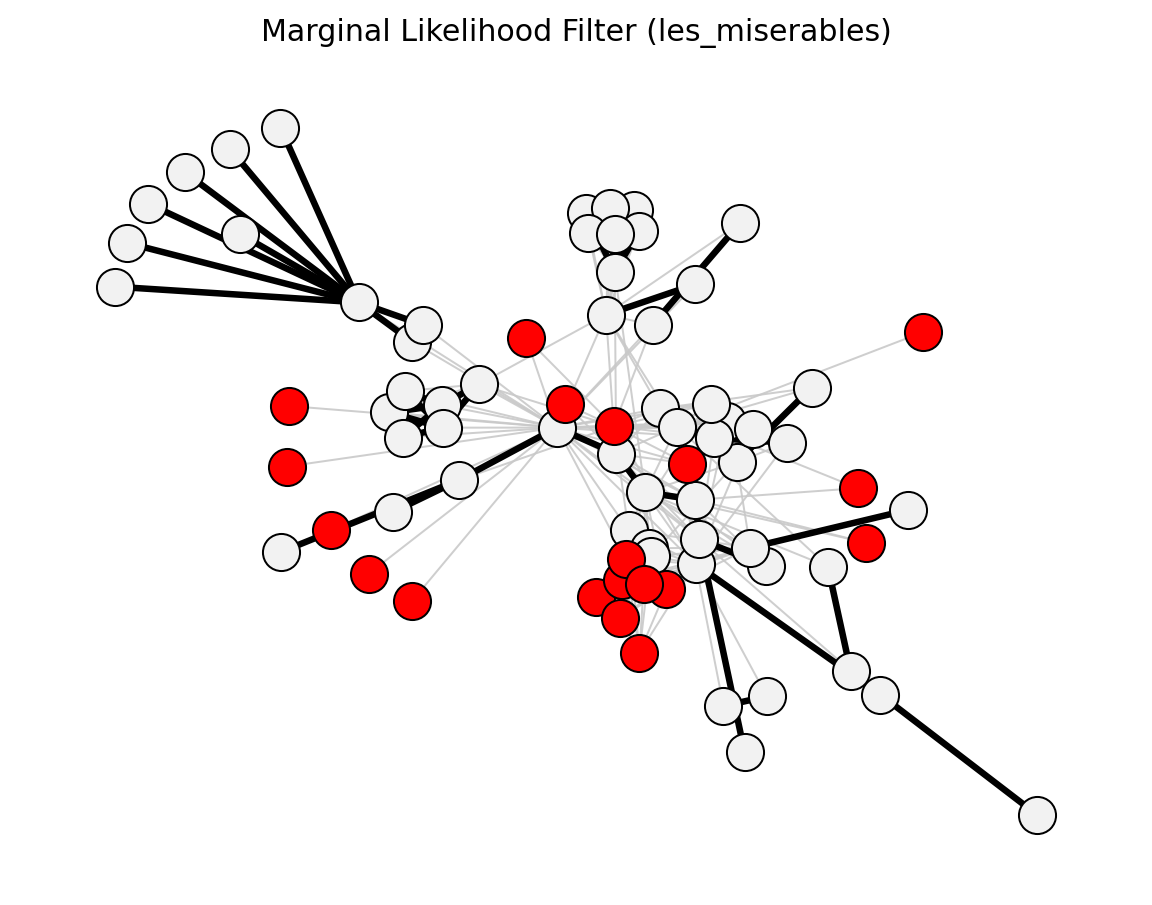
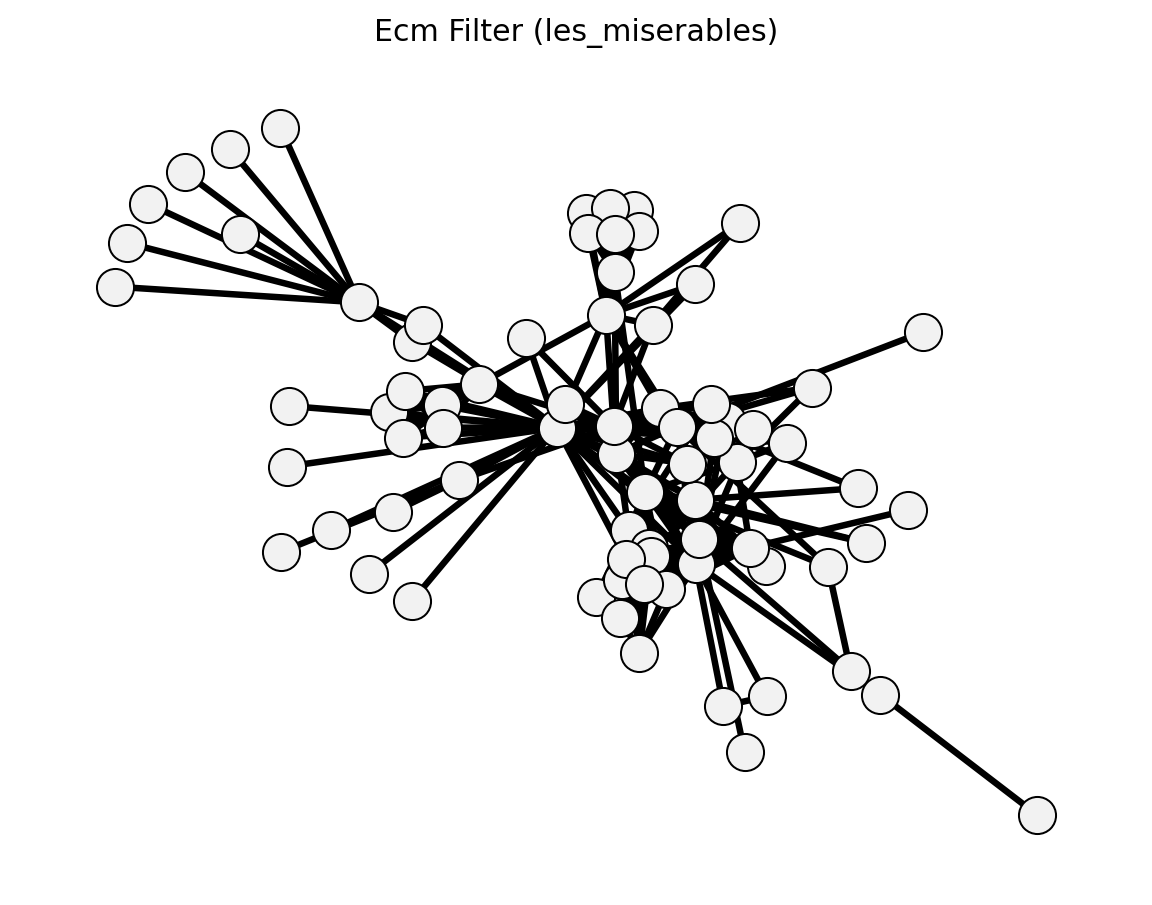
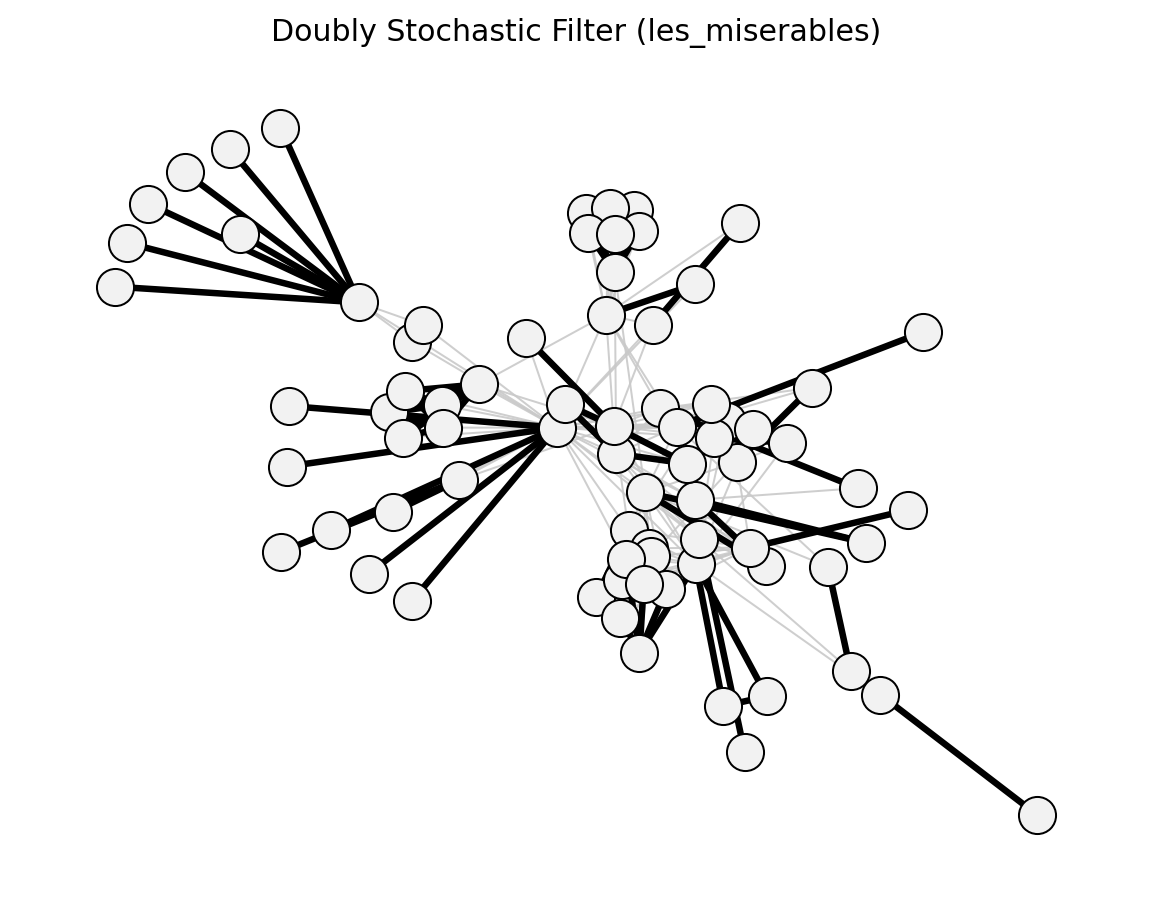
Statistical (Les Miserables)#
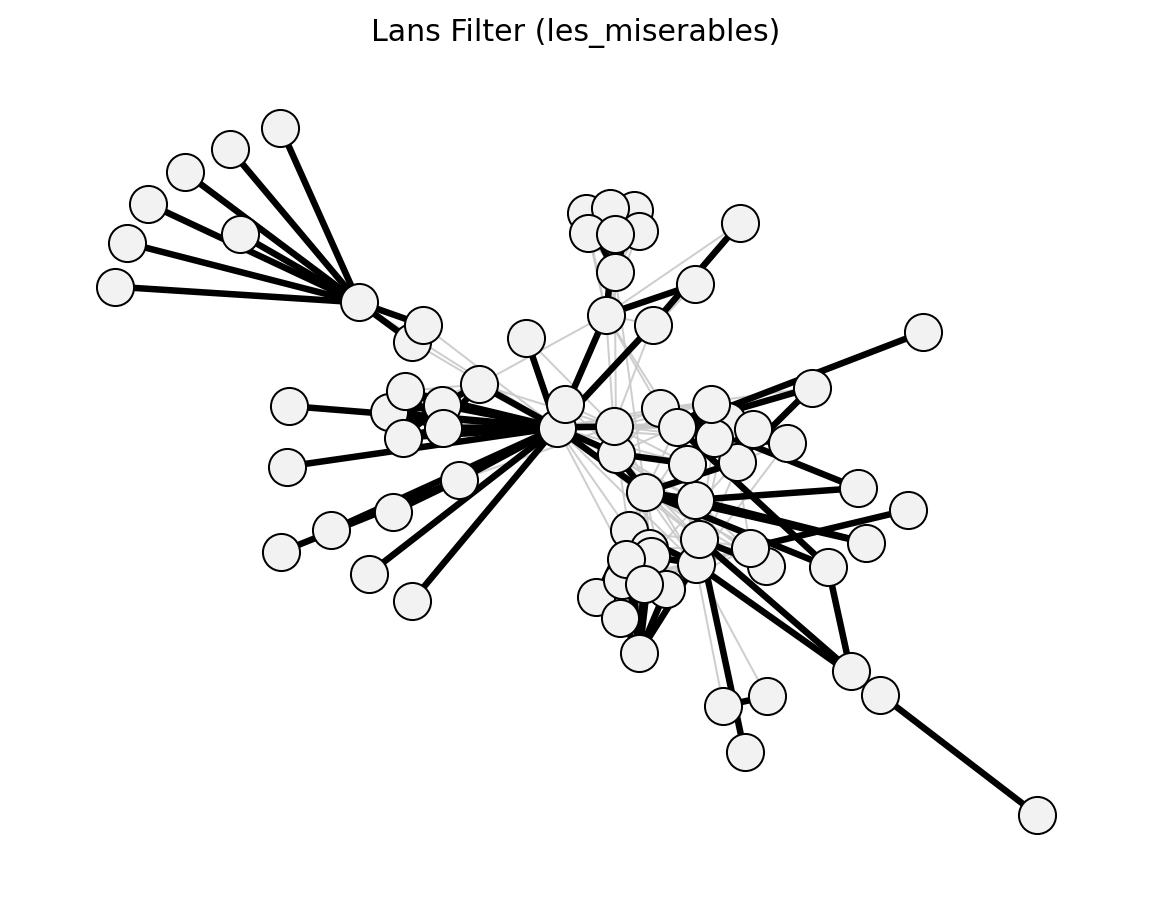
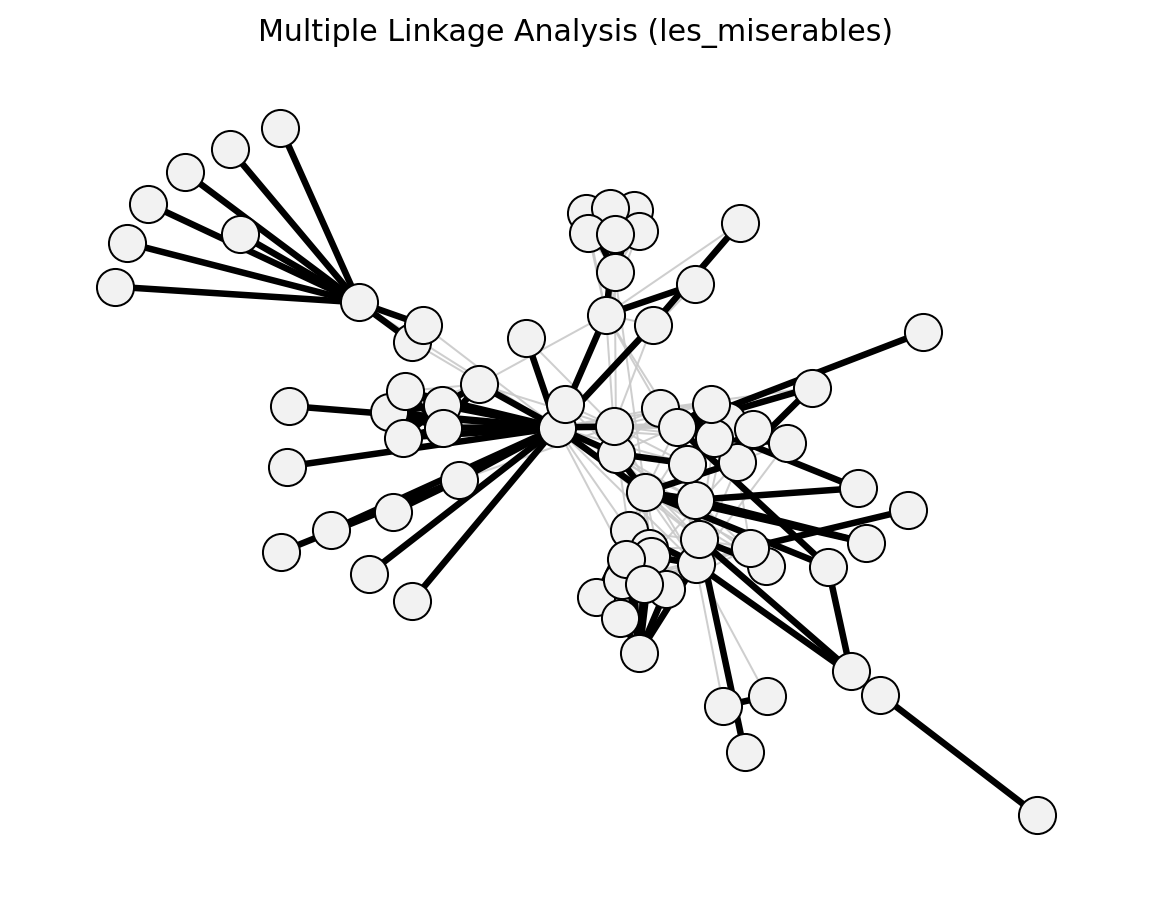
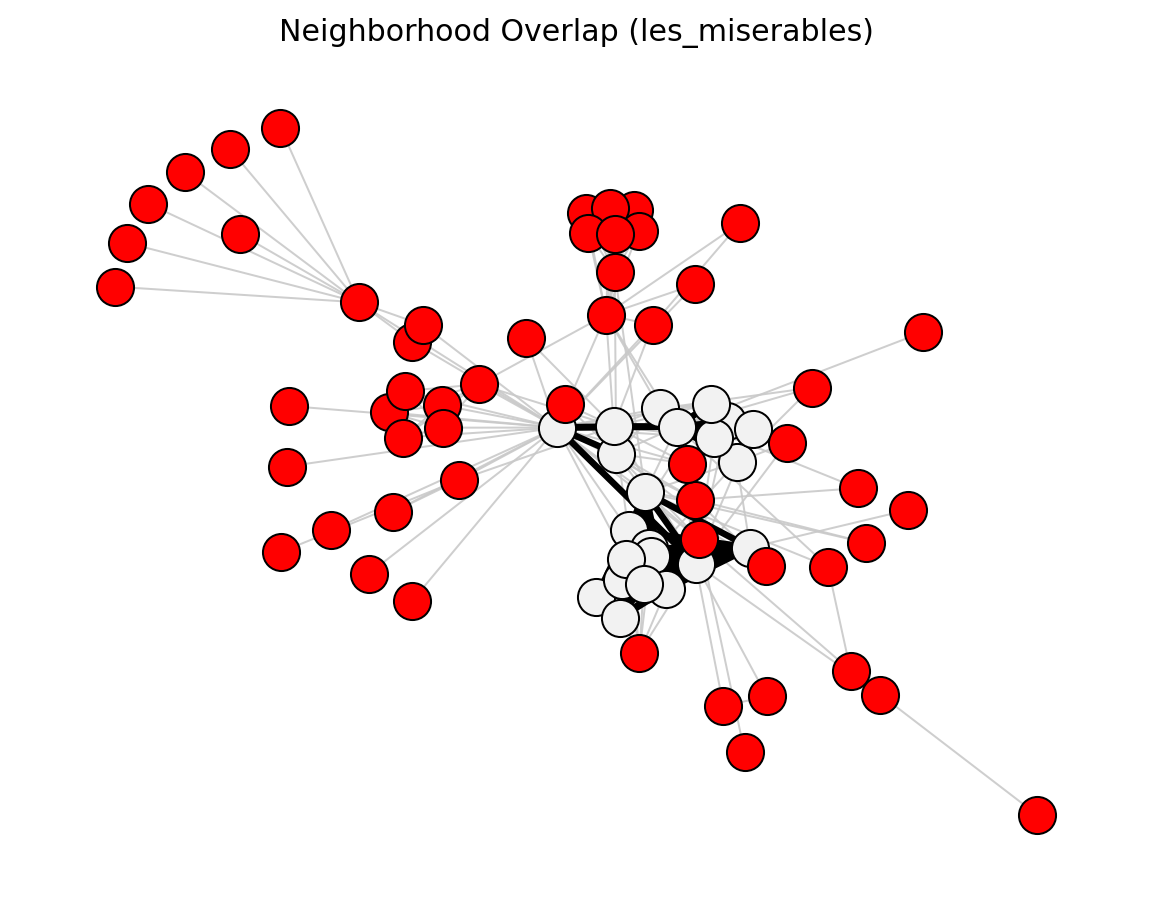
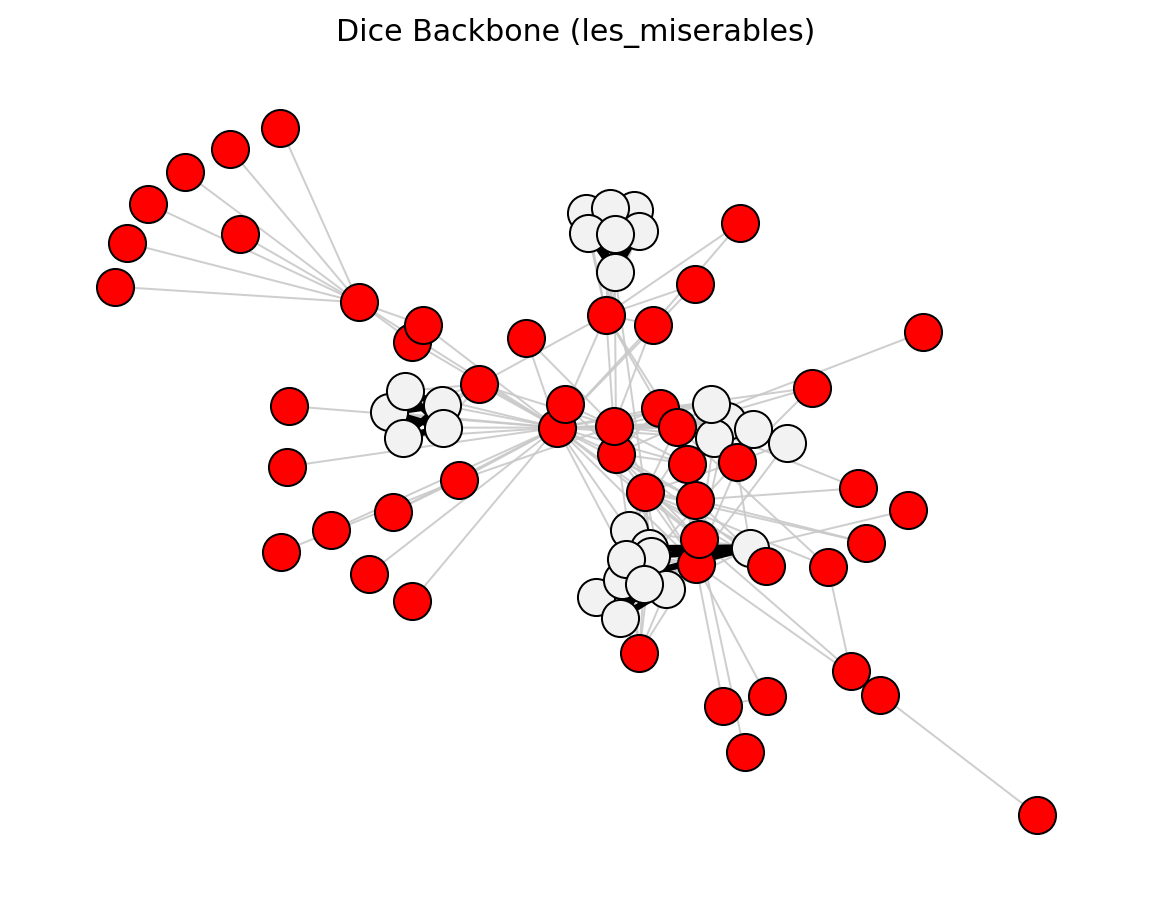
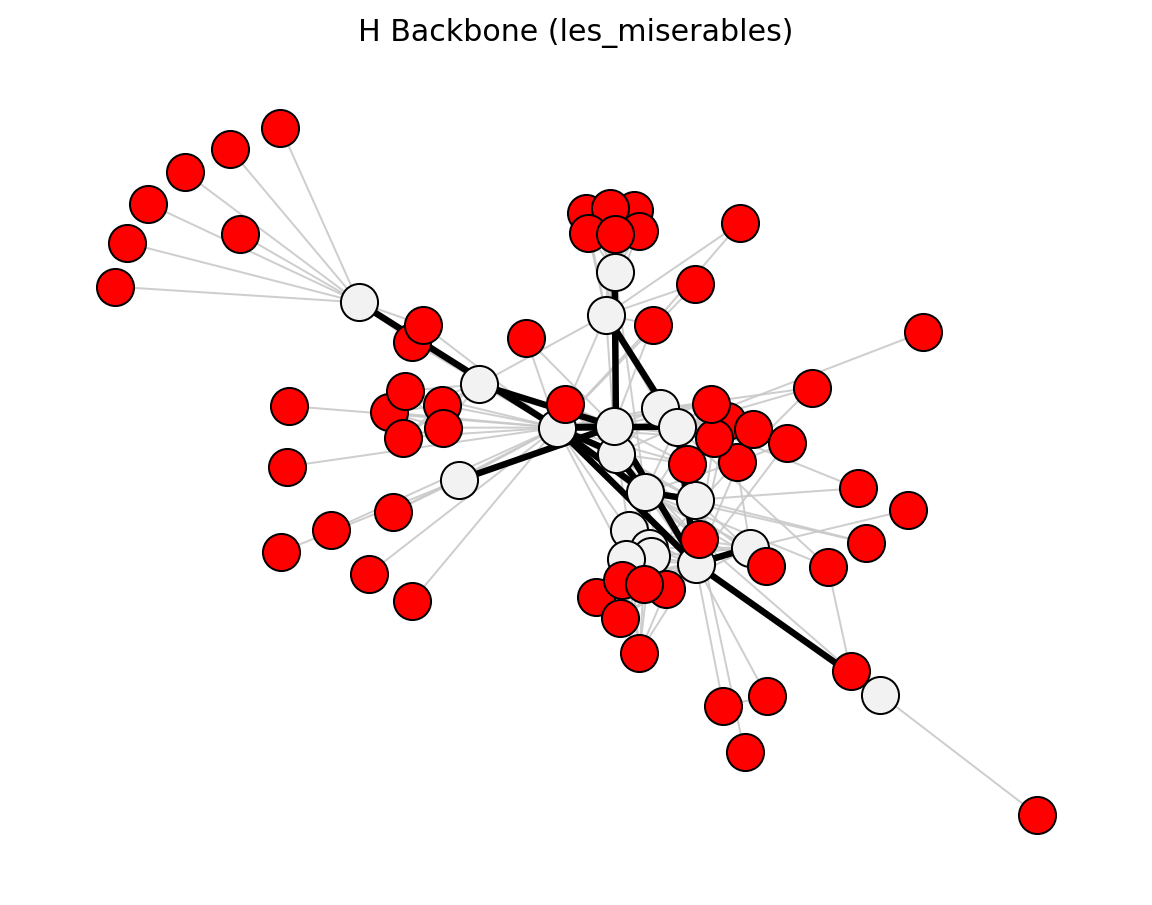
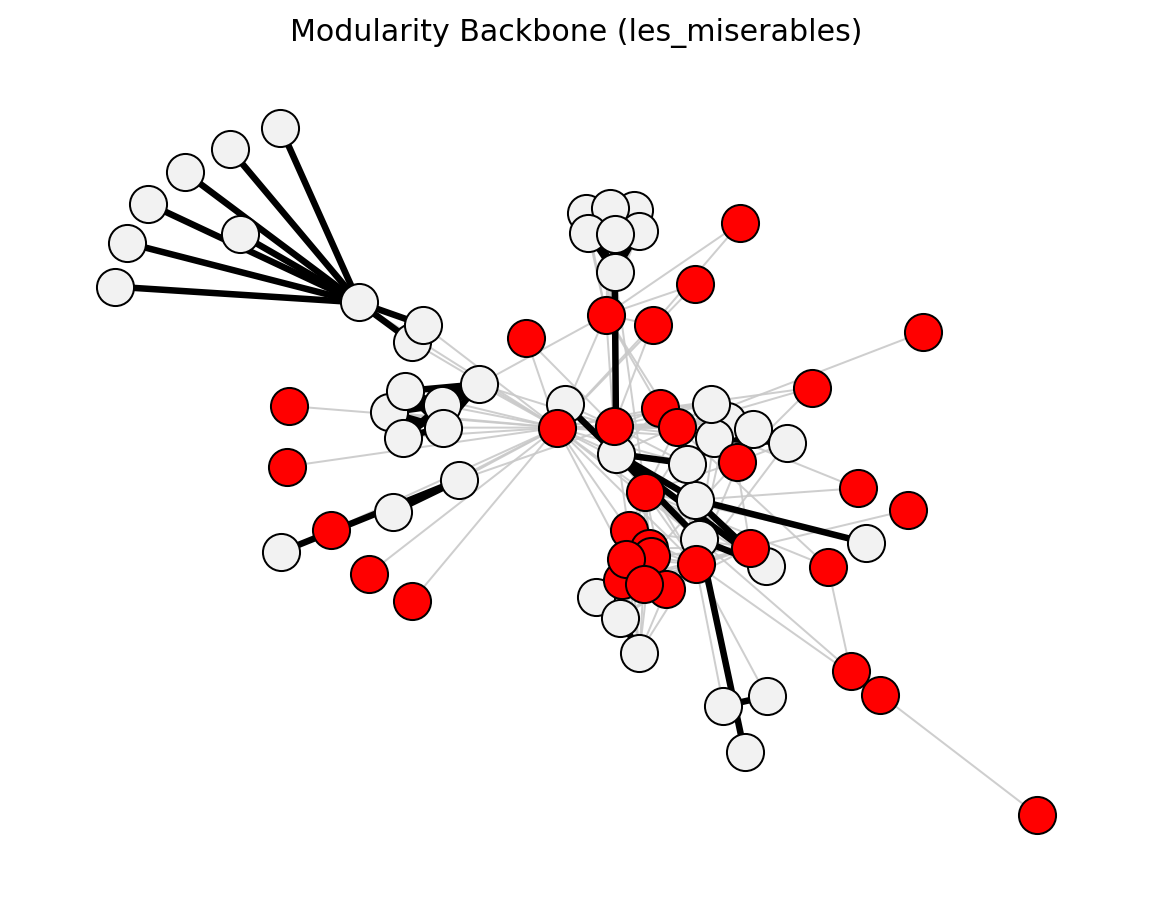
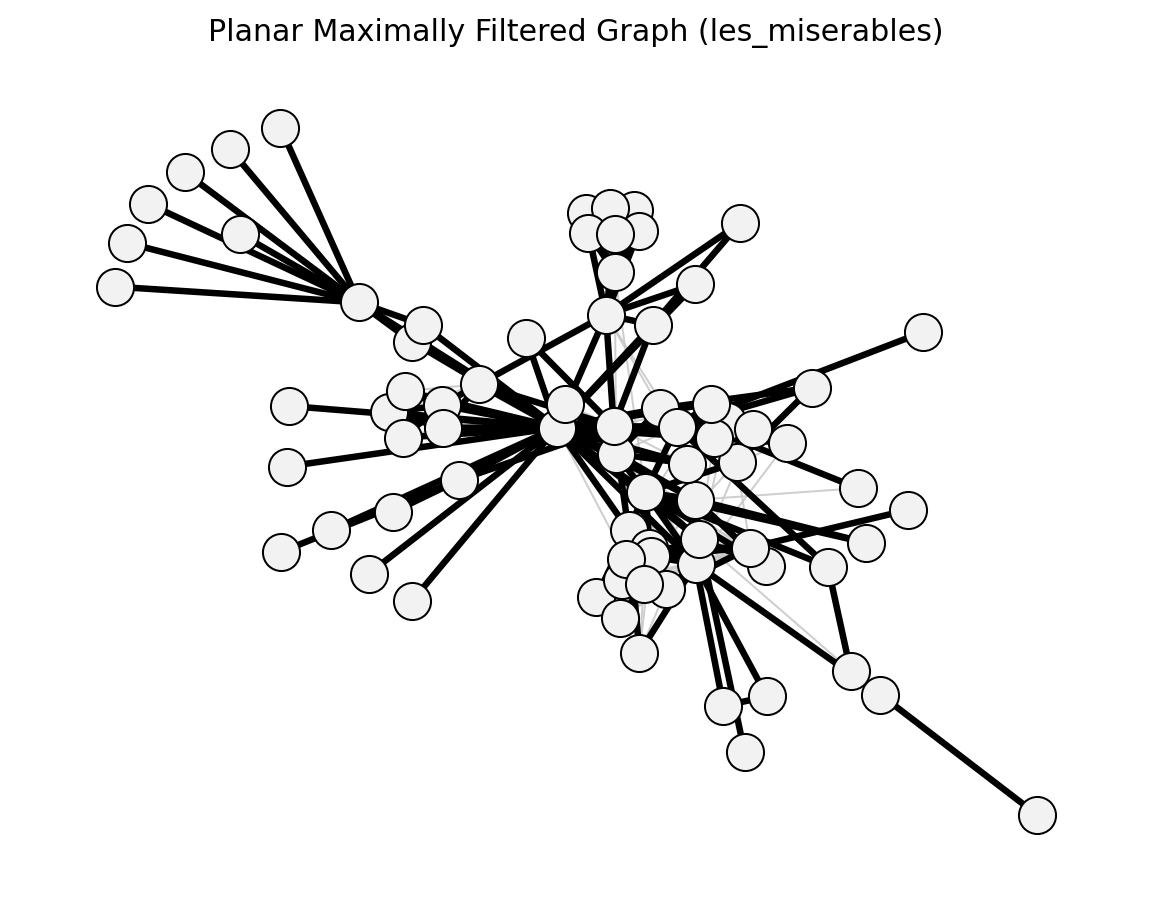
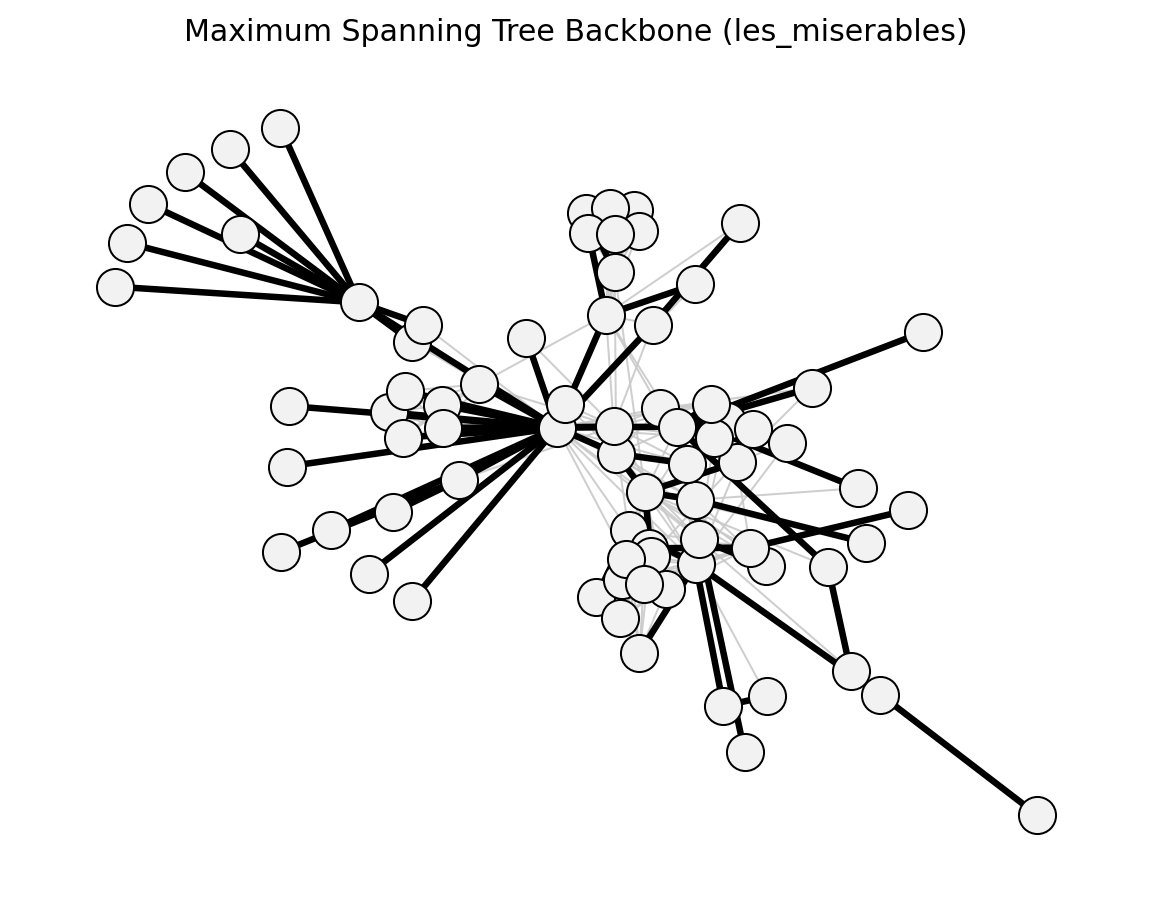
Structural (Les Miserables)#


planar_maximally_filtered_graph()
maximum_spanning_tree_backbone()
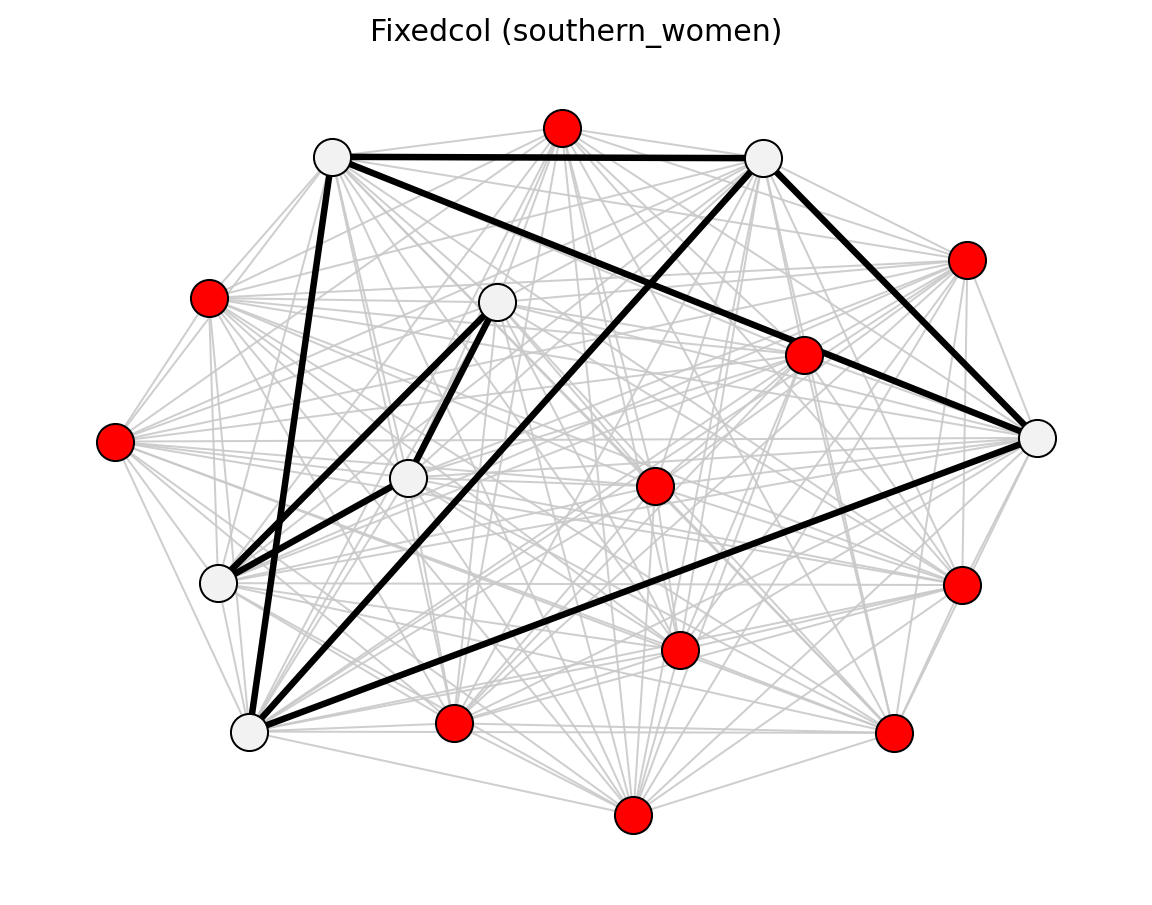
Unweighted (Les Miserables)#
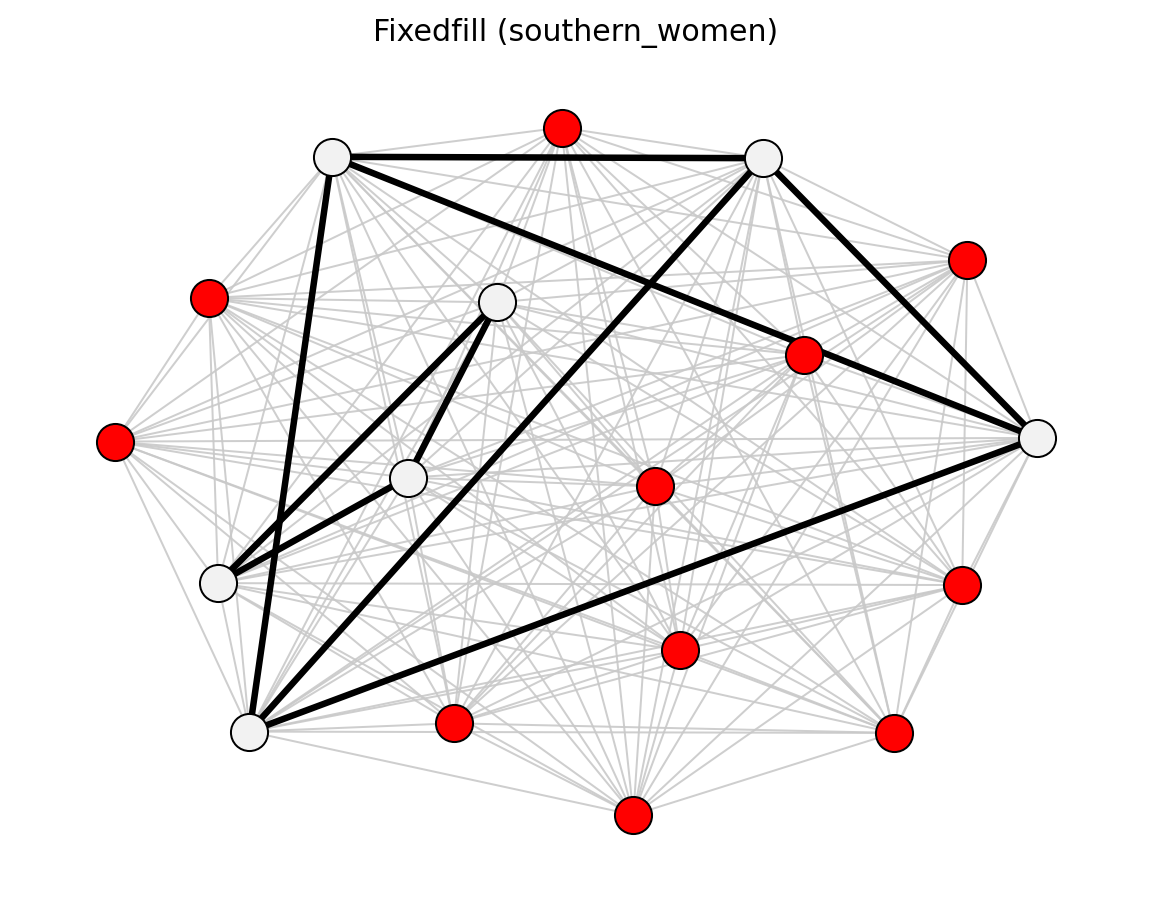
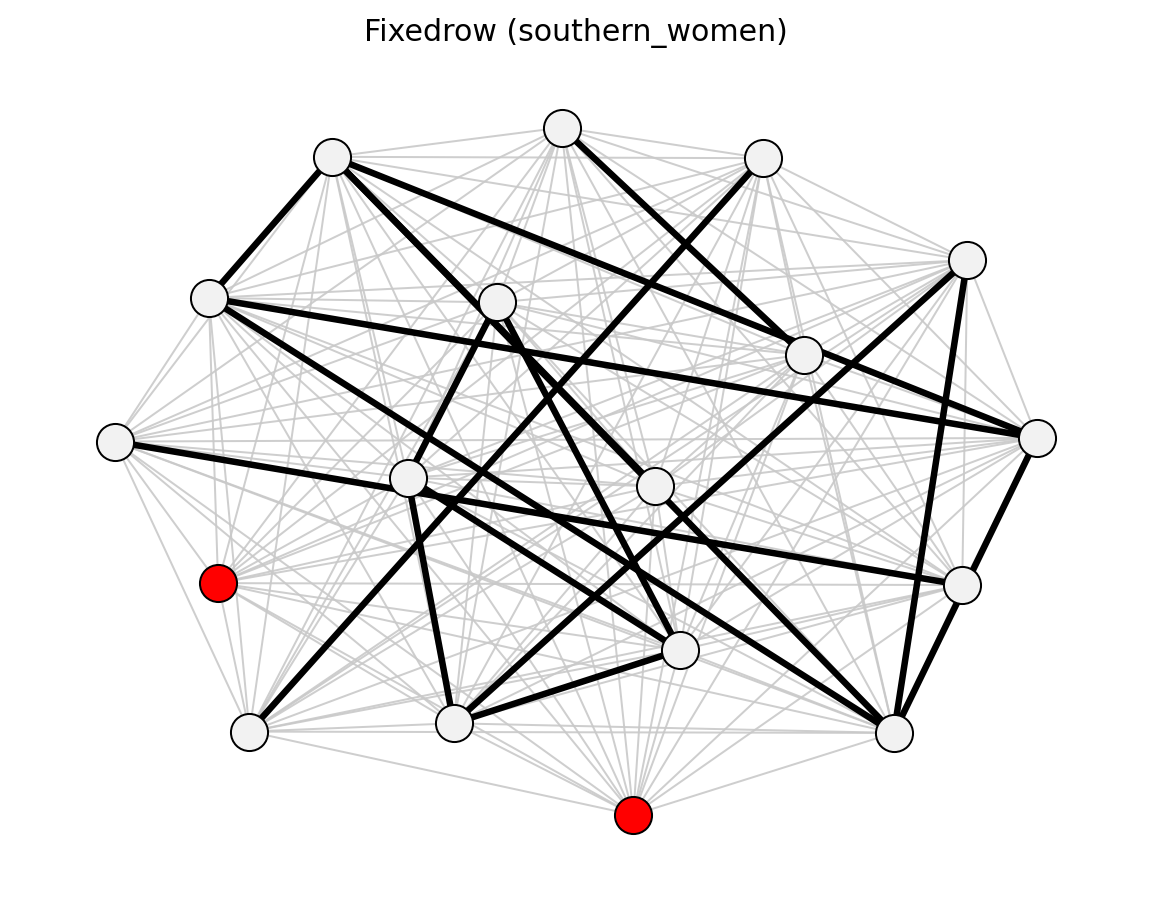
Bipartite (Davis Southern Women)#