Visualization#
Examples in this module use nx.les_miserables_graph().
Complexity classes are provided in each function docstring.
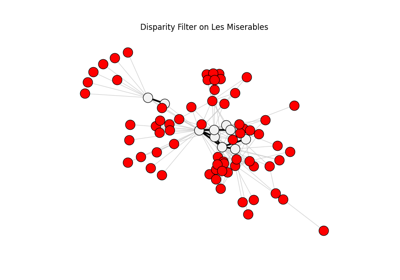
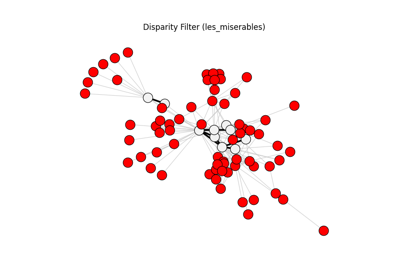
Visualization utilities for backbone comparisons.
These helpers compare an original graph with a backbone graph and render the differences using consistent defaults:
removed nodes in red
retained edges in thicker black
- networkx_backbone.graph_difference(original, backbone)[source]#
Compute node/edge overlap and removals between two graphs.
- Parameters:
original (graph) – Reference graph.
backbone (graph) – Candidate backbone graph to compare against
original.
- Returns:
diff (dict) – Dictionary containing:
"kept_nodes""removed_nodes""kept_edges""removed_edges"
Computational complexity estimate is
O(n + m)time andO(n + m)space.
- networkx_backbone.compare_graphs(original, backbone, pos=None, ax=None, with_labels=False, node_size=220, kept_node_color='#f2f2f2', removed_node_color='red', base_edge_color='#c9c9c9', kept_edge_color='black', base_edge_width=0.8, kept_edge_width=2.6, title=None, return_diff=False)[source]#
Visualize differences between an original graph and a backbone graph.
- Parameters:
original (graph) – Reference graph.
backbone (graph) – Backbone graph to compare against
original.pos (dict or None, optional (default=None)) – Node-position dictionary. If
None, usesspring_layout.ax (matplotlib Axes or None, optional (default=None)) – Axis to draw on. If
None, a new figure and axis are created.with_labels (bool, optional (default=False)) – Whether to draw node labels.
node_size (int, optional (default=220)) – Node size.
kept_node_color (color, optional) – Color for nodes retained in the backbone.
removed_node_color (color, optional (default="red")) – Color for nodes removed from the backbone.
base_edge_color (color, optional) – Base color for original edges.
kept_edge_color (color, optional (default="black")) – Color for retained backbone edges.
base_edge_width (float, optional) – Width for base/original edge layer.
kept_edge_width (float, optional (default=2.6)) – Width for retained backbone edges (drawn on top).
title (str or None, optional) – Plot title.
return_diff (bool, optional (default=False)) – If
True, return the computed graph-difference dictionary.
- Returns:
(fig, ax) or (fig, ax, diff) – Matplotlib figure/axes, and optionally the difference dictionary.
Computational complexity estimate is
O(n + m) without layout; plus layout cost if pos is Nonetime andO(n + m)space.
- networkx_backbone.save_graph_comparison(original, backbone, output_path, pos=None, dpi=180, bbox_inches='tight', **kwargs)[source]#
Save a comparison visualization to disk.
Computational complexity estimate is
O(n + m) without layout; plus rendering/write costtime andO(n + m)space.