Note
Go to the end to download the full example code.
Memify Existing Plots#
Overlay meme-style text on any matplotlib figure using
memify().
Basic Memify#
Turn an ordinary matplotlib plot into a meme by adding bold, outlined text.
import matplotlib.pyplot as plt

import memeplotlib as memes

fig, ax = plt.subplots()
ax.plot([1, 2, 3], [1, 4, 9])
ax.set_title("Quadratic growth")
memes.memify(fig, "stonks")
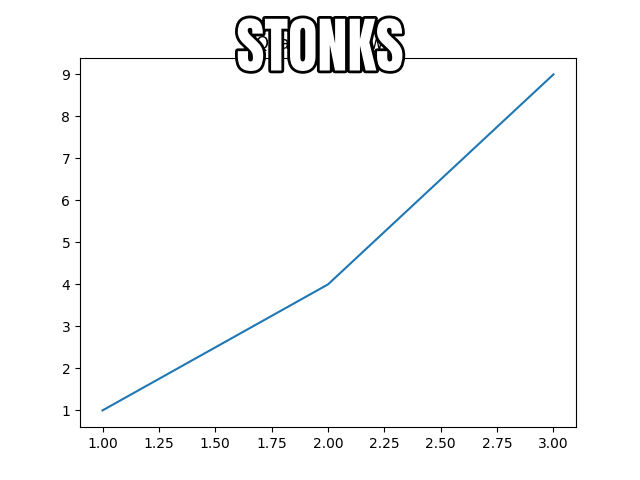
findfont: Font family ['Impact'] not found. Falling back to DejaVu Sans.

<Figure size 640x480 with 2 Axes>
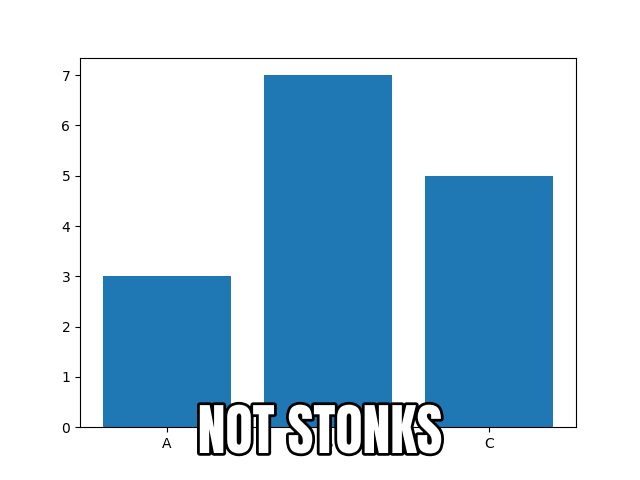
Bottom-Only Text#
Use the position parameter to place text only at the bottom of the figure.
fig, ax = plt.subplots()
ax.bar(["A", "B", "C"], [3, 7, 5])
memes.memify(fig, "not stonks", position="bottom")
<Figure size 640x480 with 2 Axes>
Total running time of the script: (0 minutes 0.126 seconds)