User Guide#
This guide covers the full breadth of memeplotlib’s functionality.
Functional API#
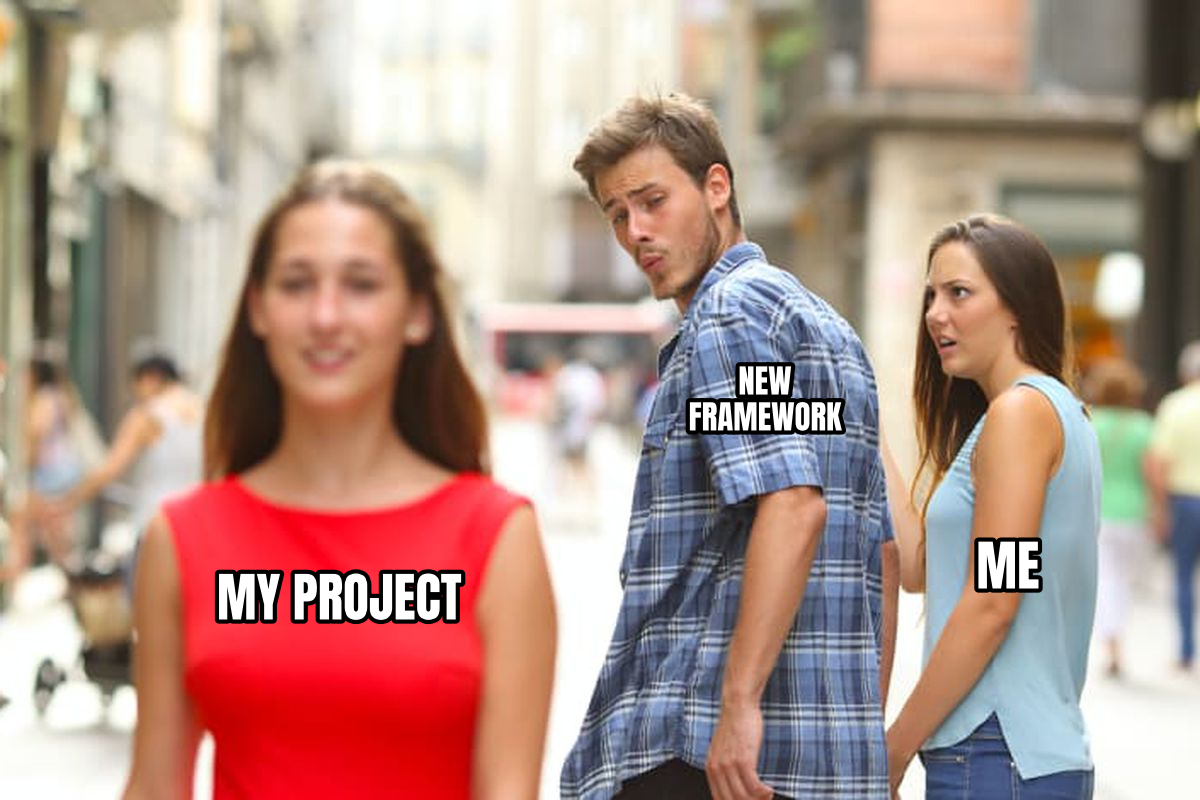
The meme() function is the quickest way to create a meme.
It returns a (Figure, Axes) tuple so you can continue to modify the plot:
import memeplotlib as memes

fig, ax = memes.meme("distracted", "my project", "new framework", "me",
                      show=False)
fig.savefig("distracted.png", dpi=200)
All text styling parameters are available as keyword arguments:
memes.meme("drake", "writing tests", "shipping to prod",
           font="impact", color="yellow", outline_color="blue",
           outline_width=3.0, style="none", show=False)

Object-Oriented API#
The Meme class provides a fluent, chainable interface:
from memeplotlib import Meme

Meme("doge").top("such code").bottom("very bug").show()

You can also build a meme step-by-step:
m = Meme("buzz")
m.top("memes")
m.bottom("memes everywhere")
fig, ax = m.render()
m.save("output.png")

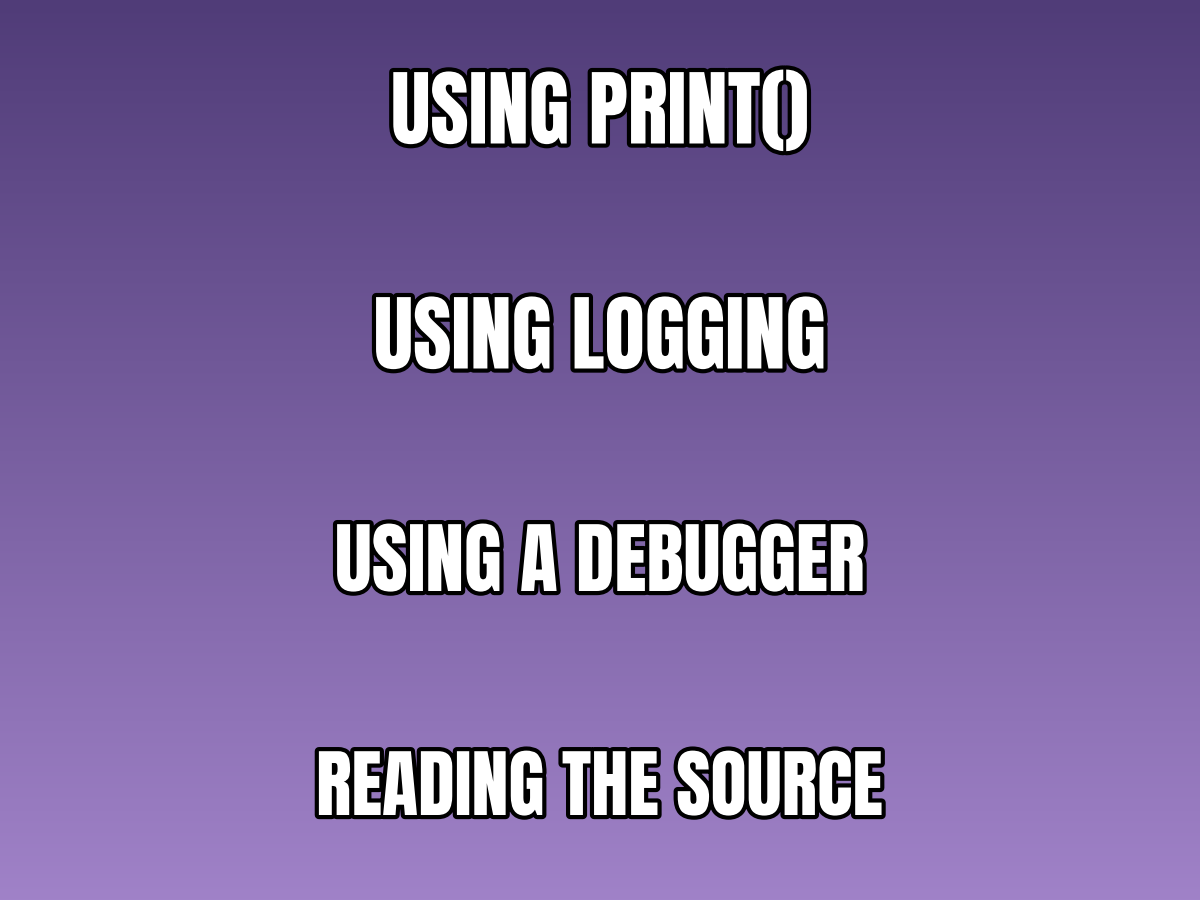
The text() method sets text at an arbitrary index,
which is useful for templates with more than two text positions:
m = Meme("expanding-brain")
m.text(0, "using print()")
m.text(1, "using logging")
m.text(2, "using a debugger")
m.text(3, "reading the source")
m.show()
You can also pass initial text lines directly to the constructor:
m = Meme("buzz", "memes", "memes everywhere")
m.show()

Memifying Existing Figures#
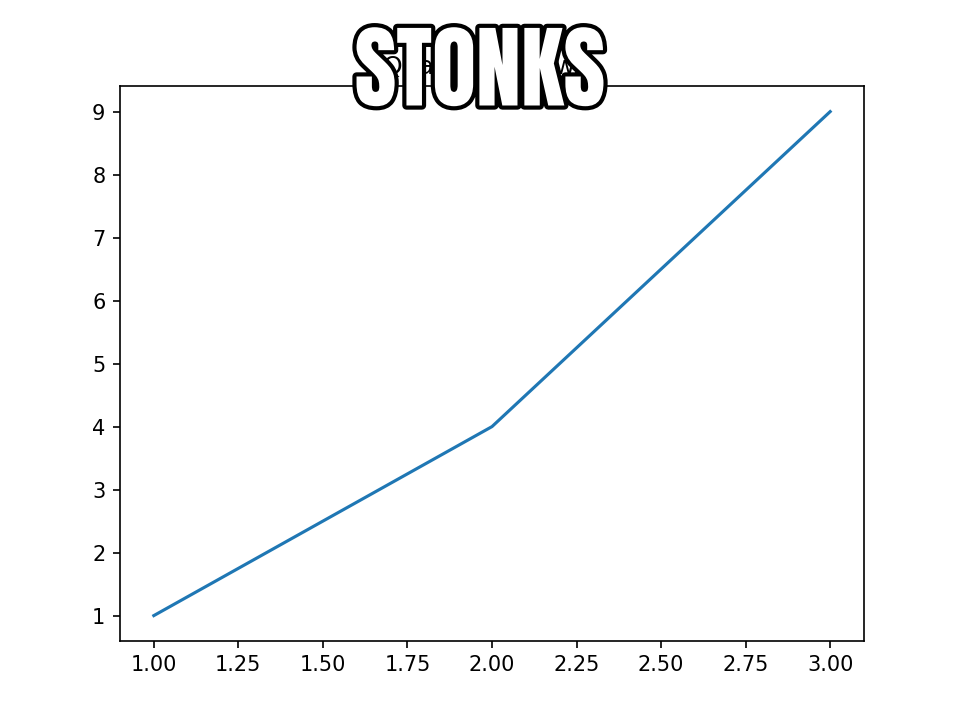
The memify() function overlays meme-style text on any
existing matplotlib figure:
import matplotlib.pyplot as plt
import memeplotlib as memes

fig, ax = plt.subplots()
ax.plot([1, 2, 3], [1, 4, 9])
ax.set_title("Quadratic growth")
memes.memify(fig, "stonks")
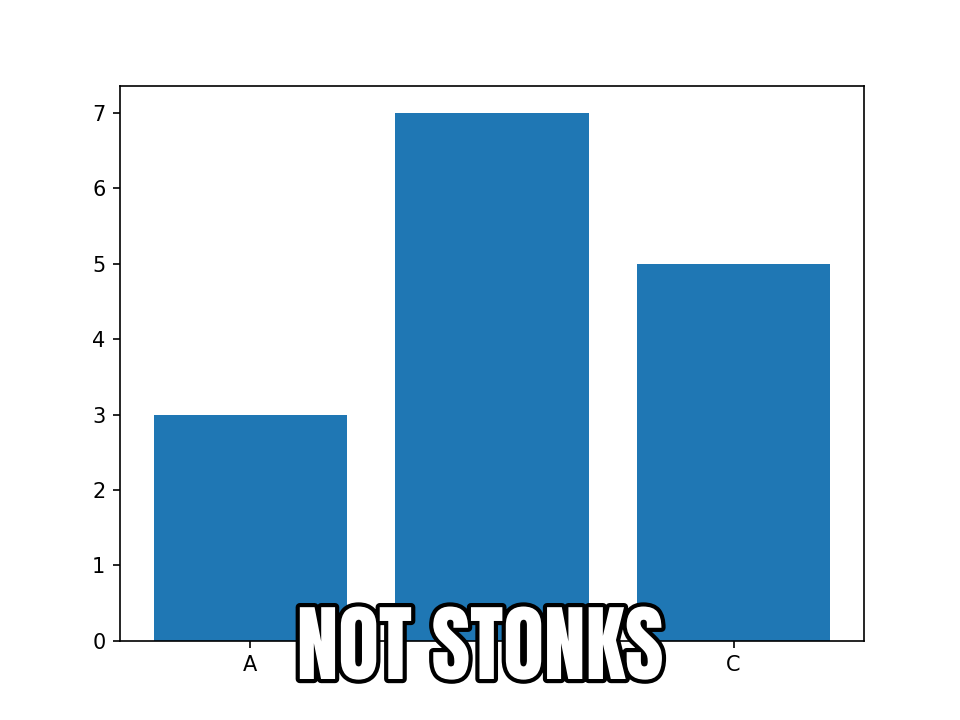
The position parameter controls text layout:
"top-bottom"(default) – text at the top and bottom."top"– text at the top only."bottom"– text at the bottom only."center"– text centered vertically.
fig, ax = plt.subplots()
ax.bar(["A", "B", "C"], [3, 7, 5])
memes.memify(fig, "not stonks", position="bottom")
Global Configuration#
The config mapping (a
MemeplotlibConfig) holds defaults that apply
to every meme creation call unless overridden by keyword arguments. It
behaves like matplotlib.rcParams — a validated key-value store:
import memeplotlib as memes

memes.config["font"] = "comic"
memes.config["color"] = "yellow"
memes.config["outline_color"] = "blue"
memes.config["outline_width"] = 3.0
memes.config["style"] = "none"
For scoped overrides that auto-restore on block exit, use
rc_context():
with memes.rc_context({"color": "yellow", "font": "comic"}):
    memes.meme("buzz", "scoped style")
# config is back to its prior values here
All configurable attributes:
Attribute |
Default |
Description |
|---|---|---|
|
|
Font family name. |
|
|
Text fill color. |
|
|
Text outline/stroke color. |
|
|
Outline stroke width. |
|
|
Base font size in points for auto-sizing. Explicit |
|
|
Dots per inch for figure rendering. |
|
|
Text transform – |
|
|
Whether disk caching is enabled. |
|
|
Custom cache directory (platform default if |
|
|
Base URL for the memegen API. |
Template Discovery#
The TemplateRegistry class lets you search and browse
the available meme templates:
from memeplotlib import TemplateRegistry

reg = TemplateRegistry()

# Search by keyword
results = reg.search("dog")
for r in results:
    print(r["id"], r["name"])

# List all templates
all_templates = reg.list_all()

# Fetch a specific template
template = reg.get("doge")

# Force refresh from the API
reg.refresh()
Templates are represented by the Template dataclass.
You can create templates from local images or URLs using class methods:
from memeplotlib import Template

# From a local image
t = Template.from_image("my_photo.jpg", lines=3, name="Custom")

# From a URL
t = Template.from_image("https://example.com/image.png")

# From the memegen API
t = Template.from_memegen("buzz")
Caching#
memeplotlib caches downloaded template images and the template catalog to disk so that subsequent runs do not require network access. The cache uses a two-level strategy:
In-memory LRU – up to 50 images kept in RAM for the current session.
On-disk file cache – images stored as PNG files, catalog as JSON with a 24-hour TTL.
The cache directory is determined by platformdirs (typically
~/.cache/memeplotlib on Linux, ~/Library/Caches/memeplotlib on macOS).
To clear the cache:
from memeplotlib._cache import TemplateCache
TemplateCache().clear()
To disable caching entirely:
import memeplotlib as memes
memes.config["cache_enabled"] = False
Rendering onto Existing Axes#
Both the functional and OO APIs support rendering onto an existing matplotlib axes, which is useful for creating subplot layouts:
import matplotlib.pyplot as plt
import memeplotlib as memes

fig, (ax1, ax2) = plt.subplots(1, 2, figsize=(16, 6))

memes.meme("buzz", "memes", "memes everywhere", ax=ax1, show=False)
memes.meme("doge", "such code", "very bug", ax=ax2, show=False)

plt.tight_layout()
plt.show()